15 min read • Last updated September 2026
I recently attended a property outlook seminar.
The seminar shared how the Singapore property market is going to do for the rest of 2026, as well as a bit on the upcoming Thomson Reserve launch.
Here is what I learned, and what I checked against the primary sources afterwards.
1. What The First Half Of 2026 Actually Did
For the first half of 2026, Singapore private home prices rose 1.4%, slower than the 1.8% recorded over the same period in 2025. Developers sold more homes than they launched in both quarters. Land bids set a new Rest of Central Region record at $1,556 psf ppr. The rest of 2026 looks firm rather than hot.
Key Takeaways
- The private residential price index rose 0.9% in Q1 2026 and 0.5% in Q2 2026, per URA. Non-landed prices actually fell 0.1% in Q2.
- Developers sold 2,013 units against 1,844 launched in Q1, and 2,141 against 1,783 launched in Q2. That is the 109% and 120% absorption you keep hearing quoted, and it is arithmetically correct.
- It is also flattered by a thin launch pipeline. When fewer units are released, the ratio rises even if demand is flat.
- The Dover Drive GLS site went for $951,000,999, or $1,556 psf ppr, on 26 March 2026. That is 32.1% above the $1,178 psf ppr paid for the Thomson View site in October 2024.
- The 15-month wait-out period for private owners buying an HDB resale flat was removed with immediate effect in late July 2026. The 30-month wait for subsidised flats stayed.
- Developer ABSD sale timelines were stretched to six and seven years for large and mega collective sale sites, but only for land bought on or after 29 July 2026.
- DBS's widely quoted $4,000 psf by 2040 assumes 2% to 3% growth a year. Private property delivered about 4.5% a year over the previous 16 years. The forecast is a slowdown, not a boom.
Five terms, one line each
The rest of this article uses these. If you already know them, skip ahead.
- psf ppr is what a developer pays per square foot of floor space it is allowed to build. It is the land cost per unit of sellable space.
- Absorption rate is units sold divided by units launched in the same period.
- GLS is Government Land Sales, where the state tenders out land to developers.
- RCR is the Rest of Central Region, the ring of city fringe districts between the core centre and the suburbs.
- Developer ABSD is Additional Buyer's Stamp Duty charged to licensed developers on residential land. Most of it is refunded if they build and sell everything within a deadline.
If the region labels are new to you, my note on how the OCR, RCR and CCR boundaries actually work sets out where the lines fall.
The first half in one table
| Measure | Q1 2026 | Q2 2026 |
|---|---|---|
| Private residential price index | +0.9% | +0.5% |
| Non-landed price index | +1.3% | −0.1% |
| New units launched (excluding ECs) | 1,844 | 1,783 |
| New units sold by developers (excluding ECs) | 2,013 | 2,141 |
| Absorption (sold ÷ launched) | 109% | 120% |
| Resale transactions | 3,225 | 3,813 |
| Vacancy rate | 6.2% | 6.4% |
Two things stand out in the table above.
Prices are still rising, but the pace is easing.
And resale volume grew 18% between the two quarters while new launch supply shrank.
2. What Is Absorption?
Absorption is a measure of the percentage of new launch supply taken up per quarter.
Unsold supply carries forward to the next quarter.
Condominium buyers can purchase from the stock sitting unsold in projects launched last year, or the year before.
So when sales exceed launches, what you are watching is the market drawing down existing inventory.
So what does it mean when absorption runs above 100%?
"120% absorption means demand is running ahead of supply."
Not quite.
Look at what happened to the denominator.
Developers launched 1,783 units in Q2 2026, fewer than the 1,844 they launched in Q1, per URA.
ERA's own research commentary on the quarter described a tighter launch pipeline that limited immediate buying opportunities.
So the ratio rose partly because the number underneath it got smaller.
If developers had launched 2,600 units in Q2 and sold the same 2,141, absorption would have printed 82% instead.
A high absorption rate in a quiet launch quarter is a supply statement as much as a demand statement.
What The Number Does Prove
It proves inventory is being cleared rather than accumulating.
That matters, because an overhang of unsold stock is what precedes most price corrections.
It also proves buyers did not go on strike when prices reached these levels.
2,141 households committed to a new home in a single quarter at current pricing.
That is genuine, and the seminar was right to point at it.
What it does not prove is that demand is accelerating.
Resale volumes climbing while launches thinned tells you buyers went looking for stock wherever they could find it.
That distinction matters when you are deciding whether to buy this quarter or next.
3. What Are Developers Paying For Land Now?
More than they were in 2024.
On 26 March 2026 the Dover Drive GLS site near one-north drew six bids.
The winning bid from Qingjian Realty with Forsea Residence and Jianan Realty Investments was $951,000,999.
URA put the site's maximum permissible gross floor area at 611,099 sq ft, including 10,764 sq ft of mandatory first-storey commercial space.
Here is the math:
The tender was awarded on 31 March 2026.
That set a new record for a residential GLS site in the Rest of Central Region, above the $1,455 psf ppr paid at Tanjong Rhu Road in February 2026 and the $1,432 psf ppr paid for the Holland Link site in the Core Central Region in July 2025.
It sits below the $1,820 psf ppr achieved at Bukit Timah Road in November 2025.
The Comparison The Seminar Made
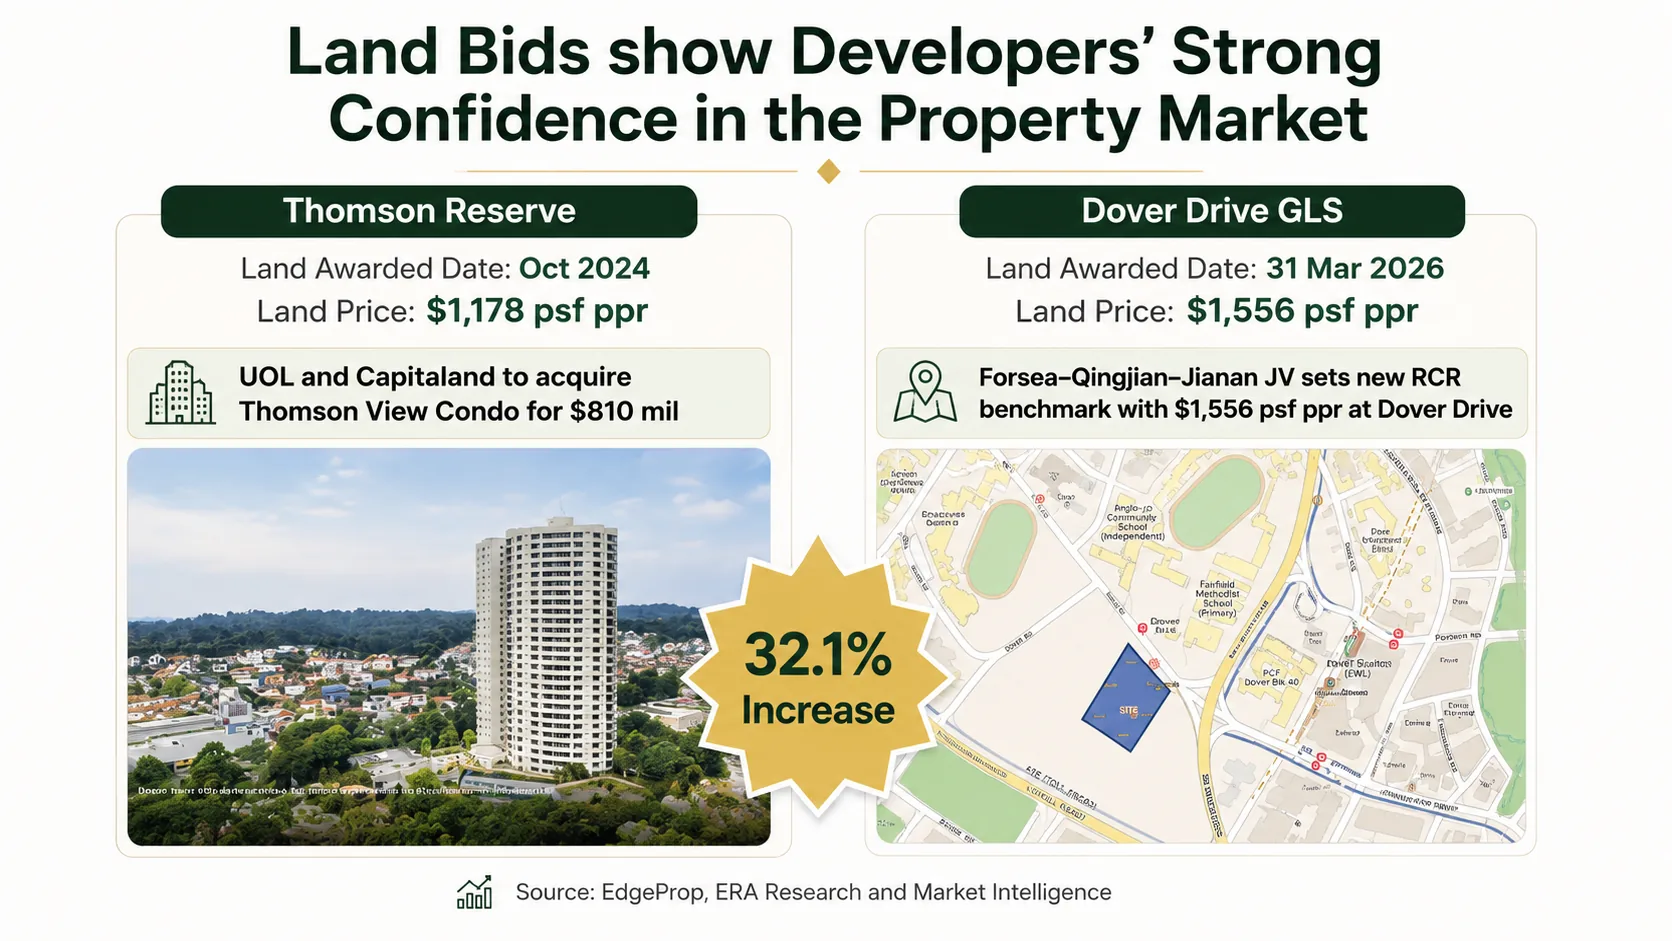
The slide above sets Dover Drive against Thomson Reserve.
Thomson Reserve's land came from the Thomson View collective sale, awarded in October 2024 at $1,178 psf ppr.
And the broad point is sound: land in the city fringe costs materially more in 2026 than it did in 2024.
But three things sit inside that 32.1% that the slide does not have room for.
One. These are two different land markets.
Thomson View was a collective sale, negotiated with a few hundred existing owners who had to agree among themselves.
Dover Drive was a government tender with six developers bidding against each other.
Both are legitimate land costs. They are not set the same way.
Two. Dover Drive is a specific story, not a general one.
The site sits next to one-north, where Singapore's artificial intelligence push has concentrated jobs and where a recent nearby launch, LyndenWoods, sold more than 94% of its units on its launch weekend in July 2025.
Developers were bidding for that catchment, not for city fringe land in the abstract.
Three. The record before Dover Drive was $1,455 psf ppr, five weeks earlier.
Measured against that, the market moved 7%, not 32%.
The 32% figure is partly a statement about how cheap the 2024 site was.
Which, to be fair, is exactly the seminar's underlying argument, and it is a fair one. I have written about what that low land cost does and does not buy you in my full review of Thomson Reserve and its $1,178 psf ppr land base.
4. Does A Higher Land Bid Guarantee A Higher Launch Price?
No.
It sets a floor under the developer's break-even, which is not the same thing as a floor under the market price.
A developer who overpays for land can still be forced to sell at a thin margin if buyers refuse the number.
That has happened before, and it will happen again.
What a high land bid tells you is what a group of professionals, with access to their own research and their own cost of capital, were willing to risk on a location.
Six bidders at Dover Drive is a stronger signal than one bidder at a higher price.
On the expected launch pricing, PropNex estimated the resulting project could average above $2,900 psf, and CBRE put the range at $2,800 to $2,900 psf.
Those are analyst estimates made in March 2026 for a project that had not been designed, let alone priced.
Treat them as a working assumption, not a fact.
The useful version of the land argument is comparative, not absolute.
If a nearby site is bought today at a materially higher land cost, the project built on it has to launch higher to make sense.
That does not make an earlier project cheap.
It makes the later project expensive, and it removes one source of competition from below.
Those are different claims and they lead to different decisions.
The Projects The Seminar Used To Make This Point
Two 2024-land-cost developments were held up as evidence that a low land base converts into a strong launch.
| Project | Land | Later comparable land | Launch outcome cited |
|---|---|---|---|
| Skye at Holland | Bought May 2024 | Vela Bay site, May 2025, $1,388 psf ppr | About 99% sold at its October 2025 launch |
| Penrith | 2024, about $1,154 psf ppr | A nearby OCR site, July 2025, $1,376 psf ppr | Launched October 2025 |
Other 2026 launches cited for strong take-up included River Modern and Pinery Residences.
The pattern is real. It is also selected.
Launches that priced ambitiously and sold slowly do not tend to appear on seminar slides, and there have been some.
A run of successful launches tells you the market cleared at those prices. It does not tell you the next one will.
My running notes on land tenders and what each result implies sit on the GLS site analysis page.
5. The 15-Month Wait-Out Period Is Gone. What Actually Changed?
Less than the headline suggests, and more than most people realise.
HDB published the change on 27 July 2026, with immediate effect.
Private residential property owners and former owners buying a non-subsidised HDB resale flat without an HDB housing loan no longer serve the 15-month wait.
The rule had been in place since 30 September 2022.
Two details did not make most of the coverage.
The 30-Month Wait Is Still There
Go for anything subsidised and the old timeline applies.
That covers:
- A BTO flat
- Sale of Balance Flats
- A resale flat bought with a CPF Housing Grant
- A new Executive Condominium from a developer
- Any purchase using an HDB housing loan
So the removal helps the cash or bank-loan downgrader.
It does not help the household hoping to sell a condo and ballot for a BTO flat.
The Sequence Flipped Back
This one changes plans.
A private owner may now buy the resale flat first and dispose of all private residential property, in Singapore and overseas, within six months of completing the flat purchase.
Between 2022 and 2026 the order was forced: sell, then wait, then buy.
Buy first, sell later, is back.
That removes the interim housing problem that made the whole move impractical for a lot of families.
Will This Push HDB Resale Prices Up?
Possibly, at the top of the market.
The naive version goes like this:
"Cash-rich private owners are coming back into the HDB resale market. Prices must rise."
Read HDB's own stated reason for the change and that gets harder to sustain.
HDB said the removal followed several quarters of price moderation in the HDB resale market, which was showing signs of stabilisation.
In other words, the friction was removed because prices had already cooled.
There is also a large wave of supply coming. Flats reaching their five-year Minimum Occupation Period are reported to climb steeply through 2028.
So there are two forces here, not one.
Supporting prices: a returning pool of buyers with more cash, concentrated in larger 5-room and executive flats, which is where downgraders actually look.
Limiting prices: a rising number of flats reaching MOP and entering the resale market at the same time.
My expectation is that the effect shows up first as more transactions rather than higher prices, and that any price effect is concentrated in the larger flat types rather than spread evenly.
If you own a 3-room flat in a non-mature estate, this policy change is not about you.
For the broader picture on how the 2026 housing rule changes interact, I went through the eligibility side separately in my piece on the 2026 HDB and EC income ceiling revisions.
6. Why Were The Developer ABSD Timelines Extended?
To make big, difficult sites worth buying.
A licensed developer buying residential land pays 40% ABSD.
Five percentage points of that are never refunded.
The other 35 points are refunded only if the developer starts, finishes and sells every unit inside a set deadline.
Miss the deadline and the 35% is clawed back with interest.
That deadline used to be 5.5 years for everyone.
From 29 July 2026, two new categories exist.
| Site category | Units after redevelopment | Old timeline | New timeline |
|---|---|---|---|
| Large en bloc site | 700 to 1,399 | 5.5 years | 6 years |
| Mega en bloc site | 1,400 and above | 5.5 years | 7 years |
The 5% non-refundable portion did not change.
The 35% refundable portion did not change.
What changed is the clock, not the tax.
The Catch Almost Nobody Mentions
The extension applies to residential land acquired on or after 29 July 2026.
It is not retroactive.
So a project whose land was bought in 2024 does not get the extra year, whatever the seminar slide implies when it says a project "could have had" six years.
That is a counterfactual about the rules, not a benefit the project holds.
If you are weighing a launch on the theory that its developer now has more time to sell, check when the land was bought first.
7. Will 2027 Bring An En Bloc Wave?
Possibly a trickle. Probably not a wave.
The seminar's argument runs like this. Government policy is nudging developers toward large collective sale sites. Previous en bloc cycles in 2007 and 2018 coincided with strong price growth. So a fresh cycle in 2027 or 2028 would push prices up again.
The first half of that is reasonable. The second half needs work.
Why A Trickle Is More Likely
Only four collective sales closed in 2025.
Large estates including Pine Grove and Braddell View have gone to market repeatedly over the years without a sale.
The reason is not the ABSD clock. It is the gap between what owners want and what developers will pay.
A longer selling deadline reduces a developer's risk of a clawback. It does not put more money in the owners' hands.
Extending a deadline lowers risk. It does not raise price.
So I expect the change to unstick a handful of the biggest, hardest sites rather than to reopen the market broadly.
And The 2018 Comparison Cuts Both Ways
Here is the line that gets left off the slide.
The 2018 en bloc cycle ended on 5 July 2018, when the government imposed cooling measures and cut the loan-to-value limit from 80% to 75%.
The seminar mentioned this. It is worth sitting with.
If a genuine en bloc wave did arrive in 2027 and prices ran, the honest base case is not that prices simply keep running.
It is that a policy response becomes more likely.
That is the pattern Singapore has repeated for twenty years, and there is no reason to assume it stopped.
An en bloc boom is a price catalyst and a cooling-measure catalyst at the same time.
If you own in an ageing estate, treat en bloc upside as a bonus rather than a plan. Roughly one attempt in ten succeeds, and re-entering the market afterwards is expensive.
8. Is New Supply Really That Tight?
For now. Not for the decade.
This is the strongest argument in the seminar and also the one most often stretched too far.
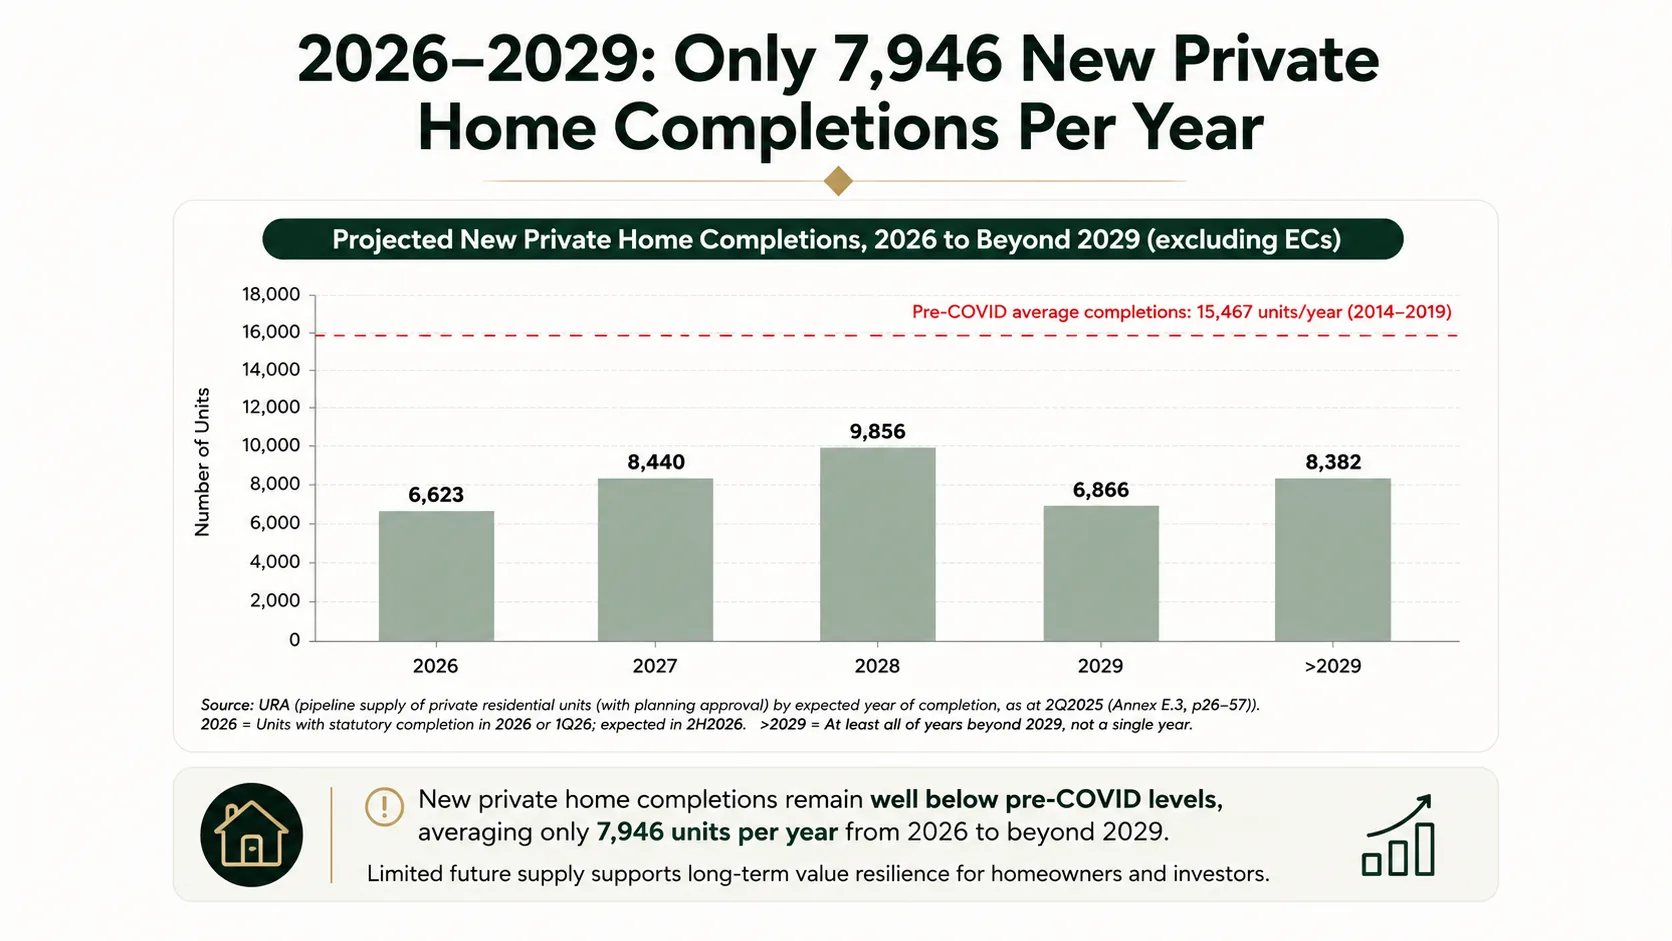
The four-year figures average out like this:
Against a pre-COVID average of 15,467 units a year over 2014 to 2019, that is roughly half.
Read the slide's own footnote before you use it, though. The bar marked ">2029" is not a year. It is everything from 2030 onwards, stacked into one column.
So the headline average deliberately excludes it, which is the correct way to compute it, but it also means the chart understates what arrives later.
One more housekeeping note. Different cuts of the same URA data give slightly different totals. The slide shows 6,623 completions for 2026. ERA's own quarterly commentary put non-landed completions at 6,282 for 2026 and 8,489 for 2027. Neither is wrong. They are counting slightly different things.
The Half Of The Story The Chart Cannot Show
Completions are the end of a pipeline, not the start of one.
What a 2026 completion figure reflects is land that was sold around 2020 and 2021, when the government was releasing very little of it.
Look at what is being released now.
URA put 9,320 private residential units on the 2026 Confirmed List, which it described as more than 50% above the average annual Confirmed List supply of the past decade.
As at the second quarter of 2026, around 60,600 private residential units including ECs sat in the overall supply pipeline.
Vacancy has already ticked up from 6.2% to 6.4%.
So there are two forces here as well.
Supporting prices: genuinely thin completions between 2026 and 2029, which is why rents have held and why buyers are competing for what exists.
Limiting prices: a deliberate, sustained land release running half again above the decade average, which lands as completed homes from roughly 2030 onwards.
The government has been explicit about the intent. It is not trying to engineer scarcity.
The supply squeeze is real and it has an expiry date.
If your holding period is five years, the tight window is your friend.
If your exit lands in 2031, you will be selling into the completions this land release creates. Plan for that.
9. Is Property Still A Hedge Against Inflation?
Historically, yes.
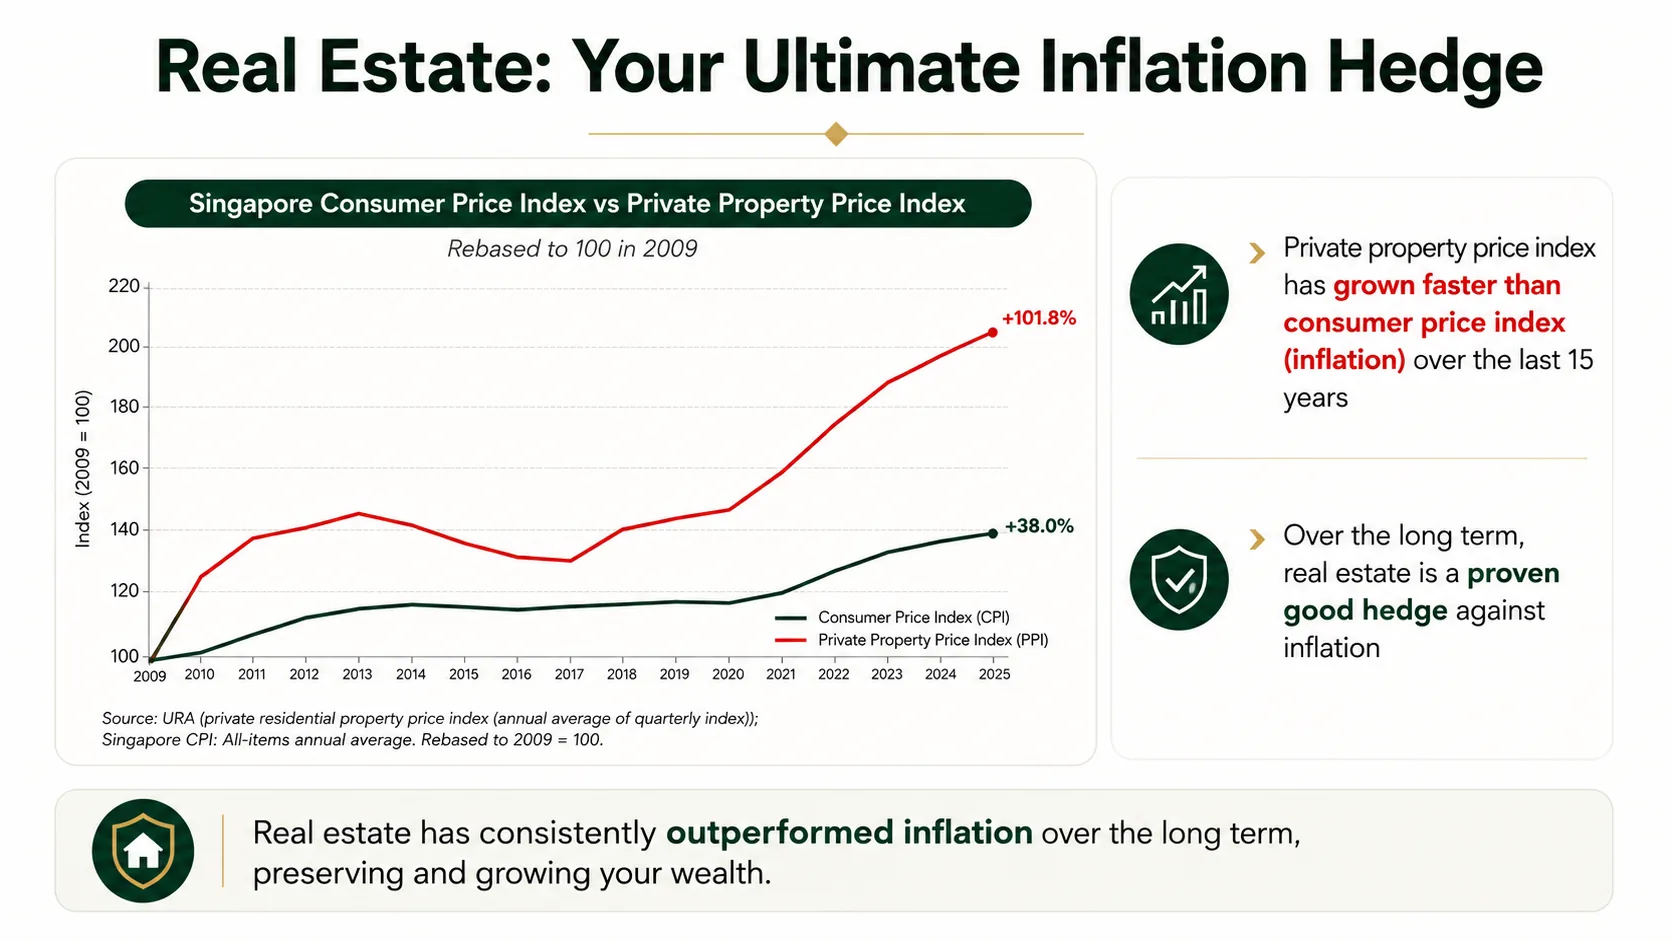
Over the sixteen years from 2009 to 2025, the private property price index rose 101.8% while consumer prices rose 38.0%.
Compound those out and the annual rates are:
Inflation: 1.380 ^ (1 ÷ 16) = 2.0% a year
So property beat inflation by roughly two and a half percentage points a year.
That is a real result and it is the most defensible claim in the whole seminar.
What The Chart Is Not Telling You
A price index is not a return.
The 4.5% figure is what the index did. It is not what an owner earned.
Out of that comes:
- Buyer's Stamp Duty on the way in
- Property tax every year
- Maintenance and sinking fund contributions
- Mortgage interest
- Agent commission and legal fees on the way out
None of those appear in an index.
Leverage cuts the other way, and this is where the seminar is right. A buyer who put down 25% and borrowed the rest earned that 4.5% on the whole property while funding a quarter of it.
That is a genuine structural advantage over most other assets a Singaporean household can access.
But leverage magnifies whatever happens, not only the good outcomes.
And the sixteen-year window on that chart starts in 2009.
2009 was the bottom of the Global Financial Crisis.
Any series that starts at a crisis low will flatter the asset.
The conclusion still stands. It just stands on a smaller pedestal than the chart implies.
10. What Does $4,000 PSF By 2040 Actually Assume?
A slowdown.
This is the finding that surprised me most, and it reverses how the forecast is usually presented.
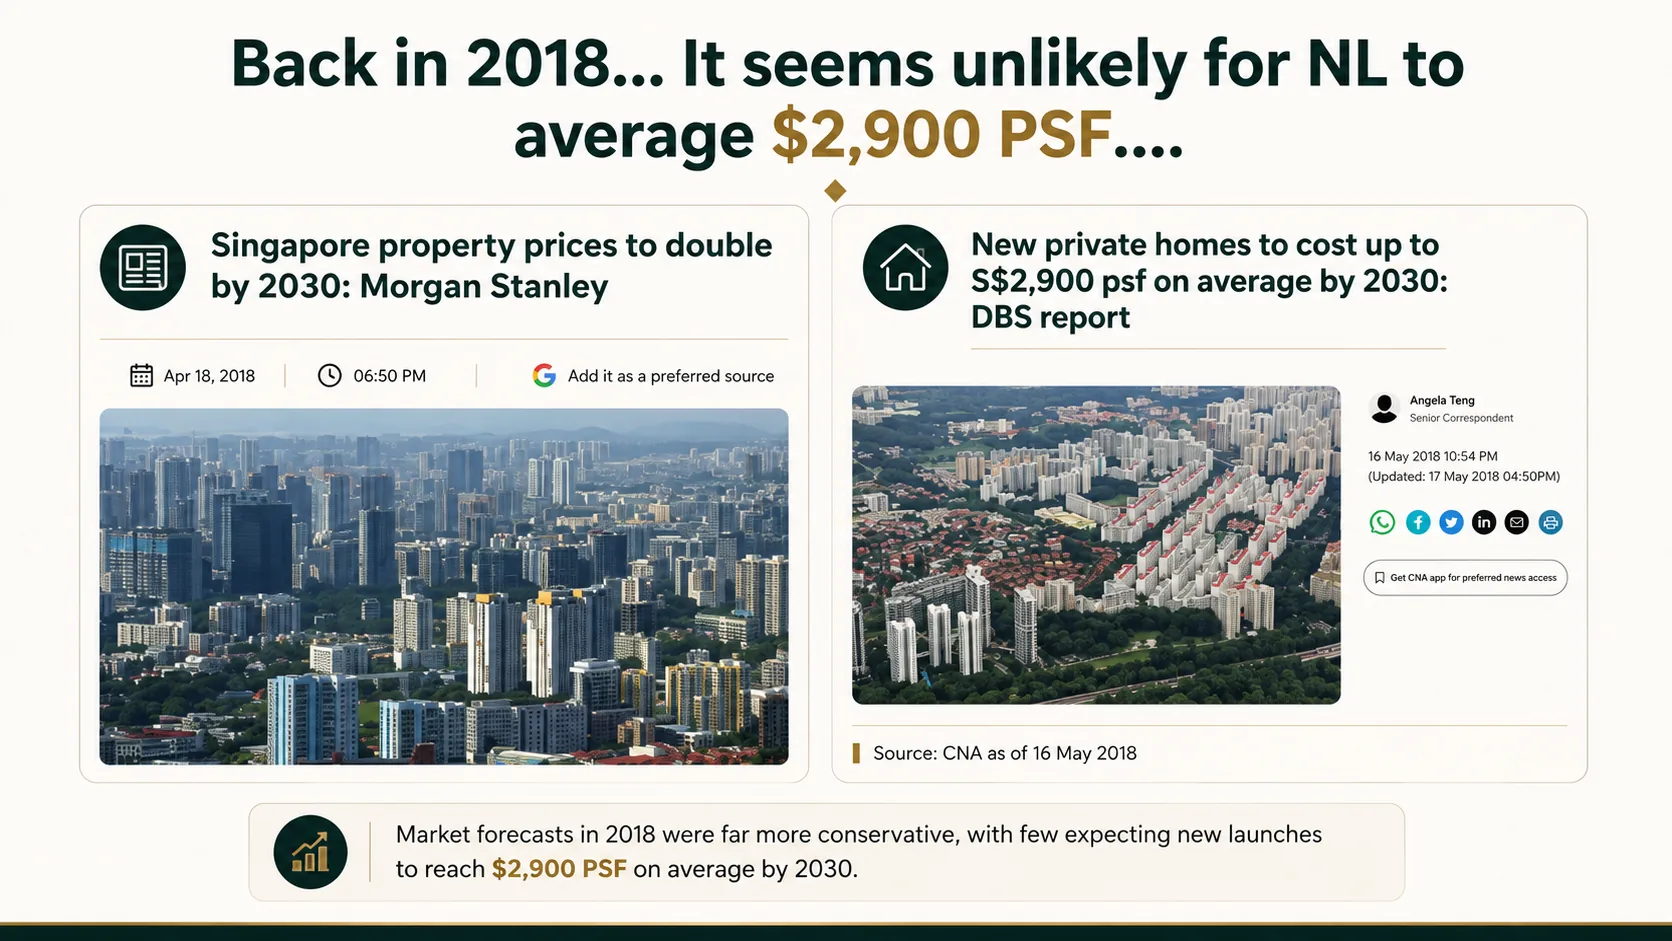
Start with the 2018 forecast, because the seminar uses it to establish credibility, and it earns that.
In 2018, DBS projected new private homes averaging $2,900 psf by 2030, from roughly $1,500 psf at the time. Morgan Stanley separately forecast prices doubling by 2030.
People laughed.
The seminar cited a Q1 2026 new-home average of $2,662 psf.
From there, reaching $2,900 psf by 2030 needs about 2.2% a year.
The 2018 forecast is going to land.
Credit where it is due. That was a good call, made when sentiment was poor.
Now Do The Same Arithmetic On 2040
DBS published a fifteen-year outlook in October 2025 projecting that average private residential prices could exceed $4,000 psf by 2040.
That is the number circulating on slides.
Here is the assumption sitting underneath it, stated in the report itself:
A long-term compound growth rate of 2% to 3% a year.
Check it against the starting point:
Now put that next to the previous section.
Private property compounded at 4.5% a year from 2009 to 2025.
DBS is forecasting 2.9% a year from here.
That is roughly two-thirds of the pace of the last sixteen years.
Which means the imagined reaction in the room is backwards:
"$4,000 psf by 2040. Prices are going to keep flying."
No.
$4,000 psf by 2040 is what you get if Singapore property grows more slowly than it has in living memory.
The headline is a big number because fourteen years is a long time, not because the growth rate is high.
And after inflation of around 2% a year, a 2.9% nominal return is under one percentage point of real price growth.
The case for buying property does not rest on that spread. It rests on leverage, on forced saving, and on the fact that you have to live somewhere.
Use the forecast. Just use it for what it says.
11. What Happens If A Recession Arrives?
Prices fall.
The seminar was straightforward about this, which I respected.
It listed the historical declines:
| Episode | Approximate quarters of price decline |
|---|---|
| Asian Financial Crisis | 10 |
| Dot-com bust | 15 |
| Global Financial Crisis | 4 |
| 2013 to 2018 cooling measures | 15 |
| COVID-19 | 1 |
The seminar's reading is that declines are getting shorter, so the market has become more resilient.
Look at the table again.
The two longest declines are the dot-com bust at 15 quarters and the 2013 to 2018 stretch at 15 quarters.
The second of those was not a recession at all.
It was policy. Cooling measures held prices down for almost four years while the economy grew.
The longest drawdown in the modern era was caused by the government, not by a crisis.
That reframes the whole resilience argument.
The risk to a Singapore property buyer has not mainly been recession. It has been buying immediately before a policy tightening.
The Three Resilience Arguments, Weighed
ABSD limits portfolio dumping. This one holds. Stacking five or eight properties is no longer realistic for most buyers, so the market has far fewer forced sellers with multiple units to unload. A household with one home rarely fire-sells it, because they still need somewhere to live.
The government has policy levers. True, and it uses them in both directions. The same toolkit that removed the 15-month wait-out in 2026 imposed it in 2022. Policy support is not a one-way promise.
Central banks can cut rates. Also true, and 2020 demonstrated it. But rates are already low. Three-month compounded SORA has spent most of 2026 around 1.0% to 1.2%, down from roughly 3.0% at the start of 2025. There is less room to cut than there was.
So the market is more resilient than it was in 1997. It is not insulated.
Plan on the assumption that you may have to hold through a bad three years, because at some point you will.
12. How Do You Reduce The Risk Of Buying The Wrong Property?
Buy for reasons that survive a bad market.
This is where the seminar was at its most useful, and I use a version of the same test with clients.
It framed three questions.
Cost. Was the land secured well below what comparable land costs today?
Demand. Are there durable reasons people will want to live or rent there in ten years?
Price. Is the entry price competitive against nearby resale and against other new launches?
A property with all three has more than one thing going for it if the market turns.
Underneath that sits a simpler checklist the seminar called SML.
- Schools within one kilometre
- MRT within a genuine walk
- Large development, meaning enough units to create an active resale market
The reasoning on schools is worth spelling out, because it is not obvious.
Every year produces a new cohort of parents who want priority admission, and priority depends on distance from the school.
That is a demand pool that renews itself rather than depleting.
MRT works the same way for tenants and for buyers who do not drive.
The large-development point is about liquidity. A 1,200-unit project generates enough transactions each year that a valuer and a buyer can both see what units are worth. A 90-unit project may go quarters without a comparable sale, and that gap costs the seller.
Where I Part Company With The Framework
It has no price discipline in it.
School, MRT and scale are attributes. Attributes get priced in.
A development with all three, bought 20% above what the location supports, is still a bad purchase.
A good property at a bad price is a bad investment.
So I would add a fourth question to the three above, and it is the one the seminar cannot ask because it was presenting a project.
What would have to go wrong for this to be a mistake, and can I survive it?
Answer that in writing before you queue for a ballot.
The framework I actually run with clients, including how I test a launch price against the resale market around it, is set out in what I look at when advising a buyer on a new launch.
And if you want to see the three questions applied to a specific 2026 launch rather than discussed in the abstract, my Thomson Reserve review works through the cost, demand and price case unit by unit. There is also a gallery and teaser film for the project if you want to see the site itself.
13. My Take: The Market Is Firm Partly Because Launches Were Thin
Put the pieces next to each other and a different picture forms than the one I was shown.
Prices rose 1.4% in the first half, slower than a year earlier.
Non-landed prices actually fell 0.1% in the second quarter.
Launches shrank in both quarters.
Resale volume jumped 18%.
Vacancy rose.
Every one of those is consistent with the same story: buyers stayed committed while the launch pipeline went quiet, so they went and bought whatever was available.
That is a healthy market. It is not an accelerating one.
And it means the second half of 2026 is a genuine test, because the launch pipeline reopens.
When more projects launch, absorption will fall below 100% on the arithmetic alone.
It will be reported as demand weakening.
It will mostly be the denominator returning to normal.
Ignore that headline when it comes.
What The Seminar Got Right
Land costs really are rising, and a project sitting on 2024 land has a cost base later projects cannot match.
Completions between 2026 and 2029 really are running near half the pre-COVID rate.
Property really has beaten inflation by about two and a half points a year since 2009.
Buyers really did absorb 2,141 new homes in a quiet quarter without flinching at the prices.
None of that is marketing. It is all checkable, and I checked it.
What I Would Not Carry Out Of That Room
That absorption above 100% proves demand is outrunning supply.
That $4,000 psf by 2040 is a bullish forecast rather than a 2.9% one.
That supply stays tight past 2029, when the 2026 land release says otherwise.
That an en bloc wave would be a one-directional positive, when the last one ended in cooling measures.
That a longer ABSD deadline benefits projects whose land was bought before 29 July 2026, because it does not.
My base case for the rest of 2026 is more of the same: low single-digit price growth, firm demand at launches that are priced sensibly, and buyer resistance at anything that reaches for a number the location does not support.
The buyers who do well over the next three years will not be the ones who bought because a slide said prices go up.
They will be the ones who bought something with a reason to be wanted in 2035.
14. What I Am Watching For The Rest Of 2026
Five things, in the order they are likely to matter.
- Launch volume in the third and fourth quarters. A return to 2,500-plus units a quarter tells you developers are confident. It will also drag absorption below 100%, which is not the same as weakness.
- Pricing at the first launches after the record land bids. Whether developers price to the new land benchmark or price to the market is the single most informative thing that will happen this year.
- HDB resale volumes rather than HDB resale prices. If the wait-out removal is working, it shows up in transaction counts for 5-room and executive flats first.
- Collective sale launches with 700 or more units. The ABSD change targets exactly this. If nothing moves by early 2027, the gap between owners and developers was always the real blocker.
- The vacancy rate. 6.4% is unremarkable. Above 7% with completions still thin would be a genuine warning about the rental assumptions people are using to justify purchases.
I will update this page when the third quarter statistics land.
15. The Short Version
If you read nothing else, read this.
- Private home prices rose 1.4% in the first half of 2026, against 1.8% in the same period of 2025. Growth is positive and easing.
- Absorption of 109% and 120% is arithmetically correct, but Q2 launches fell to 1,783 units. A thinner denominator lifts the ratio without demand moving.
- Dover Drive set a Rest of Central Region land record at $1,556 psf ppr. Measured against the previous record five weeks earlier, the move was 7%, not 32%.
- The 15-month wait-out is gone, but only for non-subsidised resale flats bought without an HDB loan. The 30-month wait for BTO, grants and ECs survives. Buy-first-sell-later is back, with a six-month disposal window.
- Developer ABSD deadlines went to six and seven years for large and mega collective sale sites, and only for land bought on or after 29 July 2026. It is not retroactive.
- Completions average 7,946 a year from 2026 to 2029, roughly half the pre-COVID rate. The 2026 Confirmed List of 9,320 units is more than 50% above the decade average, and that lands from around 2030.
- Property beat inflation by about 2.5 percentage points a year from 2009 to 2025. The window starts at a crisis low, and an index is not a return.
- $4,000 psf by 2040 implies 2.9% a year, against 4.5% a year delivered since 2009. It is a slowdown forecast.
So What Should You Do With This?
Three things.
One. Work out when you actually need to sell, then check what completes around that date. A 2031 exit and a 2029 exit face very different competition.
Two. Stop using absorption rates to time your entry. Compare a launch price against nearby resale transactions of similar age and size instead.
Three. Write down what would have to go wrong for the purchase to be a mistake, and confirm you could hold through it for three years.
Working out whether the second half of 2026 is your window? The general market picture only takes you so far. What matters is your own timeline, your existing property and what you would be selling into. Send me your situation and we can map it out.
16. Frequently Asked Questions
What is the Singapore property outlook for the rest of 2026?
Firm rather than hot. Private home prices rose 1.4% in the first half of 2026, slower than the 1.8% of a year earlier, and non-landed prices fell 0.1% in the second quarter. Demand at launches held up, with developers selling 2,141 units in Q2 against 1,783 launched. My base case for the second half is continued low single-digit price growth, with buyer resistance at anything priced beyond what the location supports.
What does a 120% absorption rate mean?
Absorption is units sold divided by units launched in the same quarter. It can exceed 100% because buyers also purchase unsold stock from projects launched in earlier quarters. In Q2 2026 developers sold 2,141 units against 1,783 launched, which works out to 120%. It shows inventory being cleared, but it is also lifted when launch volume is low, so a high reading in a quiet launch quarter says as much about supply as about demand.
Is the 15-month wait-out period for private property owners really gone?
Yes, for one specific route. HDB published the removal on 27 July 2026 with immediate effect. It applies to private property owners and former owners buying a non-subsidised HDB resale flat without an HDB housing loan. The 30-month wait-out still applies if you want a BTO flat, a Sale of Balance Flat, a resale flat with a CPF Housing Grant, a new Executive Condominium from a developer, or an HDB loan.
Can I buy an HDB resale flat before selling my condo now?
Yes, on the non-subsidised route. The sequence that applied before September 2022 has been restored, so you may buy the resale flat first and then dispose of all private residential property, in Singapore and overseas, within six months of completing the flat purchase. That removes the interim housing problem that made downgrading impractical for many families between 2022 and 2026.
Will HDB resale prices rise now that the wait-out period is removed?
Possibly in larger flat types, but the effect is likely to appear in transaction volumes before prices. HDB stated that the removal followed several quarters of price moderation in the resale market, which was showing signs of stabilisation. At the same time a rising number of flats are reaching their five-year Minimum Occupation Period through 2028. Returning private owners tend to look at 5-room and executive flats, so any price pressure concentrates there rather than spreading evenly.
How much did the Dover Drive GLS site sell for?
The winning bid was $951,000,999 from Qingjian Realty with Forsea Residence and Jianan Realty Investments, at the tender close on 26 March 2026. Against a maximum permissible gross floor area of 611,099 sq ft, that works out to $1,556 per square foot per plot ratio. The tender was awarded on 31 March 2026 and it set a new record for a residential Government Land Sales site in the Rest of Central Region.
Does a record land bid mean new launch prices will rise?
Not automatically. A high land cost sets a floor under a developer's break-even, not under what buyers will pay, and developers have accepted thin margins before when the market refused their pricing. What it does do is remove a source of cheaper competition, because later projects on expensive land cannot undercut earlier ones for long. For Dover Drive, PropNex estimated an average selling price above $2,900 psf and CBRE put the range at $2,800 to $2,900 psf, both made in March 2026 before the project was designed.
What changed with the developer ABSD timelines in July 2026?
From 29 July 2026, collective sale sites yielding 700 to 1,399 homes get six years to complete and sell every unit, and sites yielding 1,400 or more get seven years, both up from 5.5 years. Mega sites must also sell at least half their units by year six. The 5% non-remittable and 35% remittable portions of developer ABSD did not change. The extension applies only to residential land acquired on or after 29 July 2026, so it is not retroactive.
Will there be an en bloc wave in 2027?
A handful of large sites may move, but a broad wave is unlikely. Only four collective sales closed in 2025, and large estates such as Pine Grove and Braddell View have gone to market repeatedly without a sale. The blocker has been the gap between what owners want and what developers will pay, and a longer selling deadline reduces a developer's risk without raising the price it can offer. Roughly one collective sale attempt in ten succeeds, so treat en bloc upside as a bonus rather than a plan.
Is Singapore private housing supply really tight?
Until about 2029, yes. New private home completions excluding ECs average 7,946 units a year from 2026 to 2029, against a pre-COVID average of 15,467 a year over 2014 to 2019. But completions reflect land sold five or six years earlier. URA placed 9,320 private residential units on the 2026 Confirmed List, more than 50% above the average annual Confirmed List supply of the past decade, and around 60,600 units sat in the overall pipeline as at the second quarter of 2026. That supply lands as completed homes from roughly 2030.
Has Singapore property beaten inflation?
Yes, over the past sixteen years. From 2009 to 2025 the private property price index rose 101.8% while consumer prices rose 38.0%, which compounds to about 4.5% a year against 2.0% a year. Two caveats matter. The window begins at the 2009 Global Financial Crisis low, which flatters the result, and a price index is not a return because it excludes stamp duty, property tax, maintenance, mortgage interest and selling costs.
Will Singapore private home prices reach $4,000 psf by 2040?
DBS projected in October 2025 that average private residential prices could exceed $4,000 psf by 2040, based on a stated long-term compound growth rate of 2% to 3% a year. From a Q1 2026 new-home average of $2,662 psf, reaching $4,000 psf over fourteen years requires about 2.9% a year. That is roughly two-thirds of the 4.5% a year the market delivered between 2009 and 2025, so the forecast assumes a slowdown rather than an acceleration.
How far do Singapore property prices fall in a recession?
The seminar cited declines lasting about 10 quarters in the Asian Financial Crisis, 15 in the dot-com bust, 4 in the Global Financial Crisis and 1 during COVID-19. Worth noting that the other 15-quarter decline, from 2013 to 2018, was not a recession at all but the result of cooling measures. On that record, the larger historical risk to a buyer has been purchasing shortly before a policy tightening rather than before an economic downturn.
What is the Triple Margin of Safety?
It is a three-part test for reducing the risk of buying the wrong property. Cost asks whether the land was secured well below what comparable land costs today. Demand asks whether there are durable reasons people will want to live or rent there in ten years, such as schools, an MRT station or a mall. Price asks whether the entry price is competitive against nearby resale and against other new launches. I would add a fourth question: what would have to go wrong for this to be a mistake, and could you survive it?
What does SML mean in property selection?
SML stands for Schools, MRT and Large development. A primary school within one kilometre creates a buyer pool that renews itself each year as new parents seek priority admission. An MRT station within a genuine walk widens appeal to tenants and to buyers who do not drive. A large development generates enough resale transactions for buyers and valuers to see what units are worth, which a small project may not. The framework covers attributes but contains no price discipline, so a development with all three bought well above what the location supports is still a poor purchase.
Is now a good time to buy property in Singapore?
That depends on your timeline rather than on the market. Completions are thin until about 2029 and then increase as the 2026 land release delivers, so a five-year holding period faces very different competition from a nine-year one. Prices are still rising but more slowly, and buyers have shown resistance at ambitious pricing. The more useful question is whether a specific property has a reason to be wanted in 2035, and whether you could hold it through three bad years.
17. Sources, And What I Could Not Verify
Where a figure came from matters as much as the figure.
What I Checked Against Primary Sources
- Price index movements, launch and sales volumes, resale counts and the vacancy rate come from URA's release of second quarter 2026 real estate statistics, dated 24 July 2026.
- The Confirmed List and pipeline figures come from URA's second quarter 2026 flash estimate release.
- The wait-out removal, its conditions and HDB's stated reason come from HDB's own announcement, published 27 July 2026.
- The developer ABSD timeline categories come from IRAS's page on ABSD housing developer remission timeline extensions.
- The Dover Drive bid amount, gross floor area and bidder names were reported by The Edge Singapore and EdgeProp following the 26 March 2026 tender close. I reproduced the $1,556 psf ppr rate from the bid and the GFA myself.
Two Calculations I Reproduced
Absorption for both quarters, from URA's own launch and sales counts.
The land rate at Dover Drive, from the bid divided by the permissible gross floor area.
Both matched the figures presented. That is worth saying plainly, because it means the seminar's headline numbers were not exaggerated.
What Came From The Seminar And Is Not Independently Verified
These are presenter figures. I have used them because they are internally consistent, but they carry less weight than the items above.
- The Q1 2026 new-home average of $2,662 psf.
- The completions series of 6,623, 8,440, 9,856, 6,866 and 8,382 units, and the pre-COVID average of 15,467 a year.
- The index values of +101.8% and +38.0% on the inflation chart.
- The quarters of price decline in each historical episode.
- The household income distribution figures, which are nominal and unadjusted for the roughly 2% a year inflation over the same period.
- The land rates cited for Skye at Holland, Penrith and the sites compared against them.
What I Left Out
The seminar cited annual intakes of 40,000 new permanent residents and 30,000 new citizens from 2026 onwards. I could not match those to a published government commitment, so I have not built any argument on them.
It also compared rental and resale figures between two Woodleigh developments. The numbers in my source material were internally inconsistent, so I have left that comparison out entirely rather than repeat figures I do not trust.
Update Log
Published September 2026. I will refresh this page when URA releases third quarter 2026 statistics, or sooner if a cooling measure, a GLS award or an HDB policy change lands before then.
18. My Thoughts
I do not think the seminar was dishonest.
Almost everything in it was checkable, and almost all of it checked out.
What a seminar cannot do is put the qualifier next to the number, because a qualifier slows a room down.
So absorption becomes proof of demand rather than a ratio with a shrinking denominator.
A slowdown forecast becomes a growth story because the headline figure is large.
A supply squeeze becomes permanent because the chart stops at 2029.
None of those are lies.
They are what happens when a true number is asked to carry more weight than it can hold.
The market underneath all of it is in reasonable shape.
Prices are rising slowly. Buyers are turning up. Land is not cheap and is not getting cheaper. Completions are thin for another three years and then they are not.
That is a market where careful buying works and careless buying gets punished slowly, which is the worst way to be punished, because you do not notice for years.
You do not need the market to be exceptional.
You need to be right about one property.
Weighing a move in the second half of 2026? Bring me the specifics: what you own, when you need to move, and what you are looking at. I will tell you if the numbers say stay put. Start the conversation here.
Disclaimer: This article is provided for informational purposes only and should not be construed as financial advice, investment recommendation, or an offer to buy or sell property. While we have made efforts to ensure the accuracy of the information presented, market conditions, developer plans, and regulatory environments are subject to change. Property prices, launch dates, unit availability, and other details mentioned are based on current market intelligence and may be subject to revision. Prospective buyers should conduct independent research, verify all information directly with developers and relevant authorities, and consult with qualified financial and legal advisors before making any property purchase decisions. We are committed to accuracy and transparency; however, the information provided should not be regarded as an offer, statement, representation, or guarantee. While we strive to ensure the information is correct, it may not always be complete, up to date, or free from errors. Users are strongly encouraged to exercise due diligence and verify details through direct inquiries. Our agents and this website shall not be held liable for any decisions or actions taken based on the information provided here.