
Geek Out #04
Besides the 12 two-track schools, which primary schools have the least public housing within 2km?
Published · Data current to HDB, URA and SLA data downloaded from data.gov.sg on 1 October 2026, and Phase 2C results to 2026
Using HDB’s and URA’s public data, only MOE’s 12 two-track schools have less than 40% public housing within 2km. The closest of the other 170 are River Valley Primary (41%), Haig Girls’ (42%) and Farrer Park Primary (46%). River Valley and Haig Girls’ are just above 40%. MOE says it will review the list from time to time.
This page measures the housing around each school from public data. It isn’t MOE’s own count, and it doesn’t predict which schools MOE will add.
What this page found, in five lines
MOE’s 12 two-track schools have the least public housing within 2km · tap for the rest
- The 12 schools with the least public housing within 2km are MOE’s 12 two-track schools. They range from Raffles Girls’ Primary (5%) to Tanjong Katong Primary (38%).
- Three more schools have between 40% and 50% public housing within 2km. River Valley Primary (41%), Haig Girls’ (42%) and Farrer Park Primary (46%). St Joseph’s Institution Junior is next, at 50%.
- River Valley (41%) and Haig Girls’ (42%) are just above 40%. A slightly different way of drawing the 2km boundary could put either one below it. Draw the boundary 200m closer to the school, and River Valley drops to about 38%.
- At Haig Girls’ and Farrer Park, every citizen family who applied in Phase 2C got a place, every year from 2022 to 2026. River Valley had a ballot among citizens in 2022, 2023 and 2024.
- Most schools have far more public housing nearby. At the other 170 schools, public housing averages 79% of the homes within 2km.
Which primary schools have the least public housing within 2km?
In September 2026, The Straits Times published the share of public housing around each of the 12 two-track schools. I counted the same way, using HDB’s and URA’s public data, for all 182 primary schools.
These are the 20 primary schools with the least public housing within 2km, using HDB’s and URA’s public data. The first 12 are exactly MOE’s two-track schools. Tanjong Katong Primary (38%) is the last school below 40% public housing within 2km, and River Valley Primary (41%) the first above it.
| # | School | Public housing within 2km |
|---|---|---|
| 1 | Raffles Girls’ Primary SchoolTwo-track | 5% |
| 2 | Singapore Chinese Girls’ Primary SchoolTwo-track | 6% |
| 3 | Methodist Girls’ School (Primary)Two-track | 10% |
| 4 | Anglo-Chinese School (Junior)Two-track | 16% |
| 5 | Anglo-Chinese School (Primary)Two-track | 19% |
| 6 | Pei Hwa Presbyterian Primary SchoolTwo-track | 19% |
| 7 | Ngee Ann Primary SchoolTwo-track | 22% |
| 8 | Nanyang Primary SchoolTwo-track | 24% |
| 9 | St Margaret’s School (Primary)Two-track | 26% |
| 10 | Tao Nan SchoolTwo-track | 28% |
| 11 | CHIJ (Katong) PrimaryTwo-track | 30% |
| 12 | Tanjong Katong Primary SchoolTwo-track | 38% |
| MOE’s stated criterion for the 12: public housing is less than 40% of homes within 2km | ||
| 13 | River Valley Primary School | 41% |
| 14 | Haig Girls’ School | 42% |
| 15 | Farrer Park Primary School | 46% |
| 16 | St Joseph’s Institution Junior | 50% |
| 17 | Kong Hwa School | 51% |
| 18 | Bukit Timah Primary School | 53% |
| 19 | Alexandra Primary School | 56% |
| 20 | Temasek Primary School | 58% |
These figures may differ slightly from MOE’s own count, so River Valley (41%) and Haig Girls’ (42%) could fall on either side of 40%. Every school is in the full table further down.
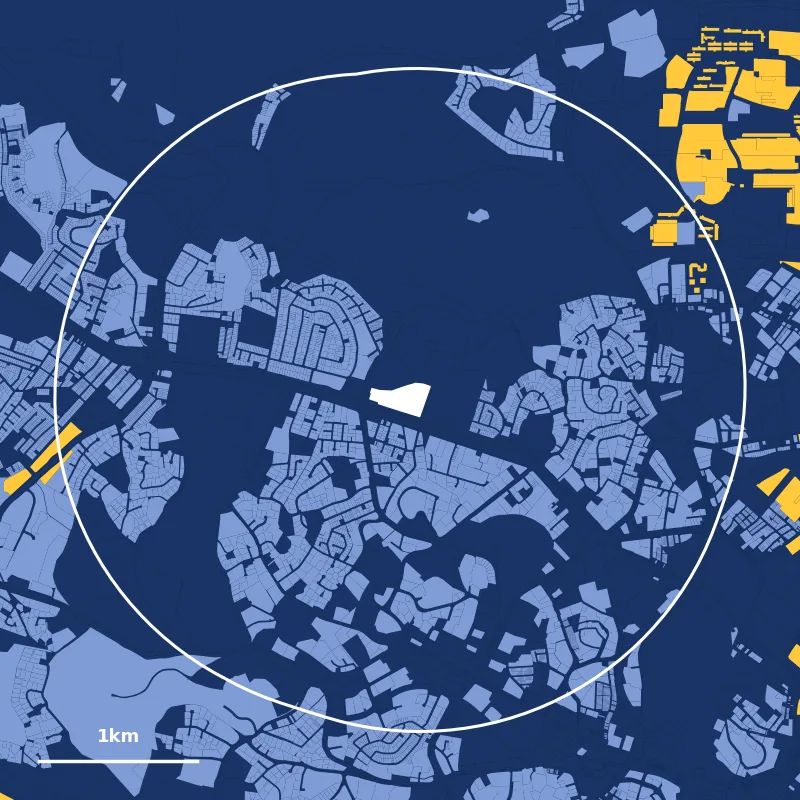
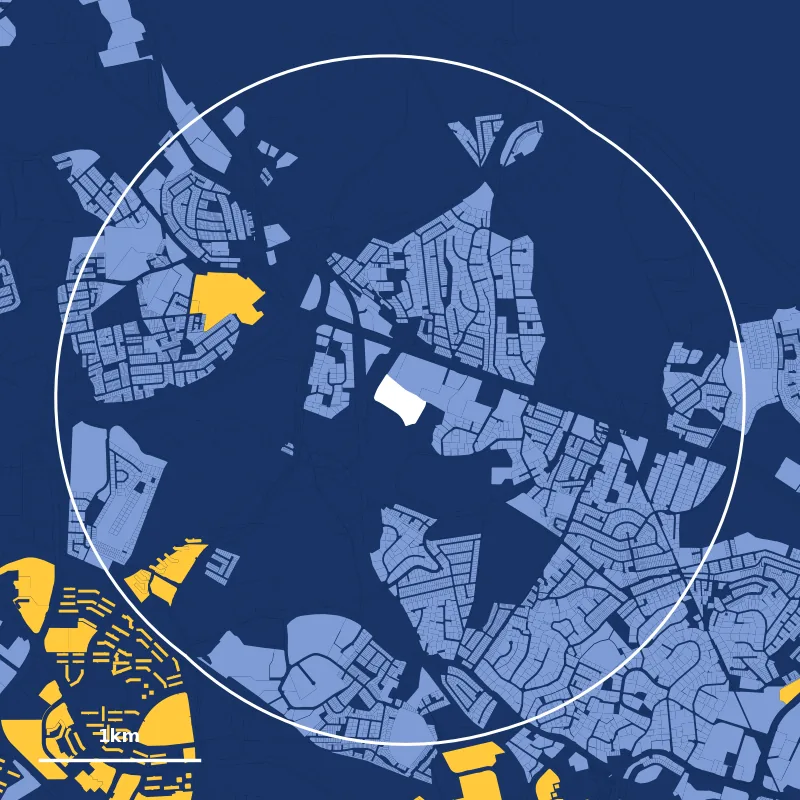
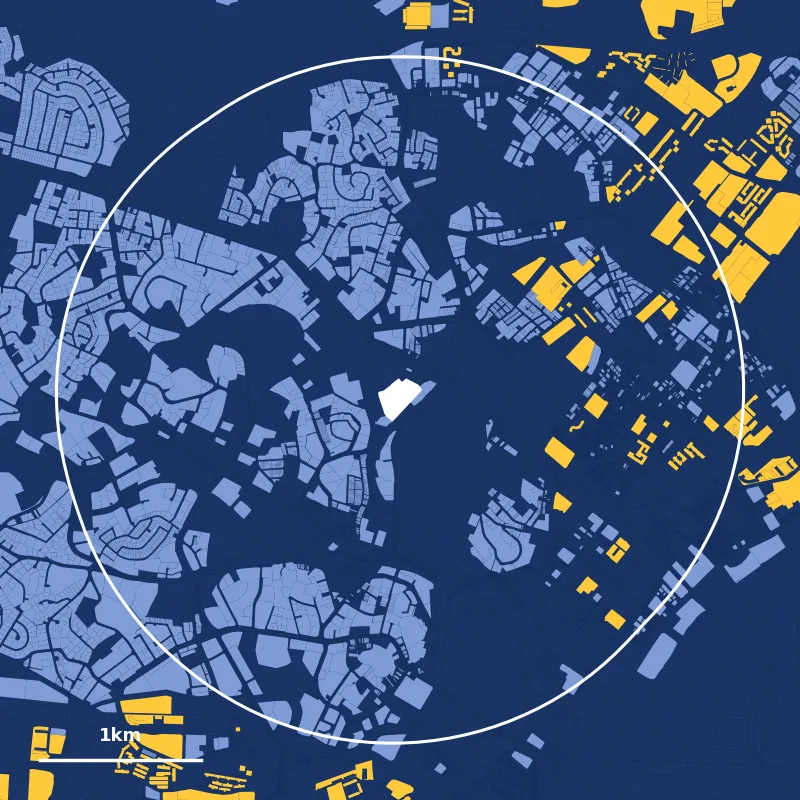
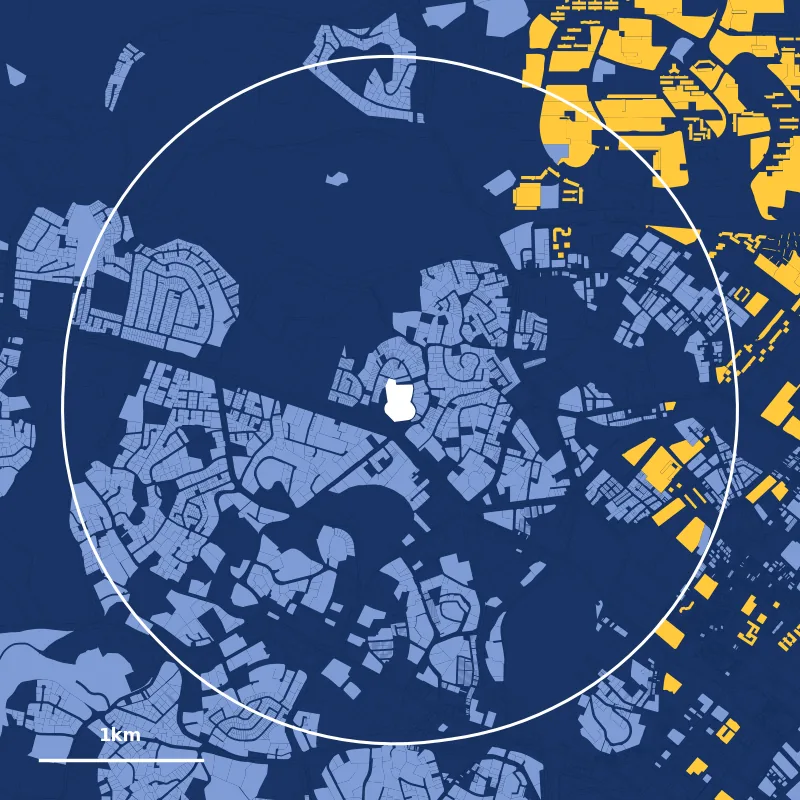
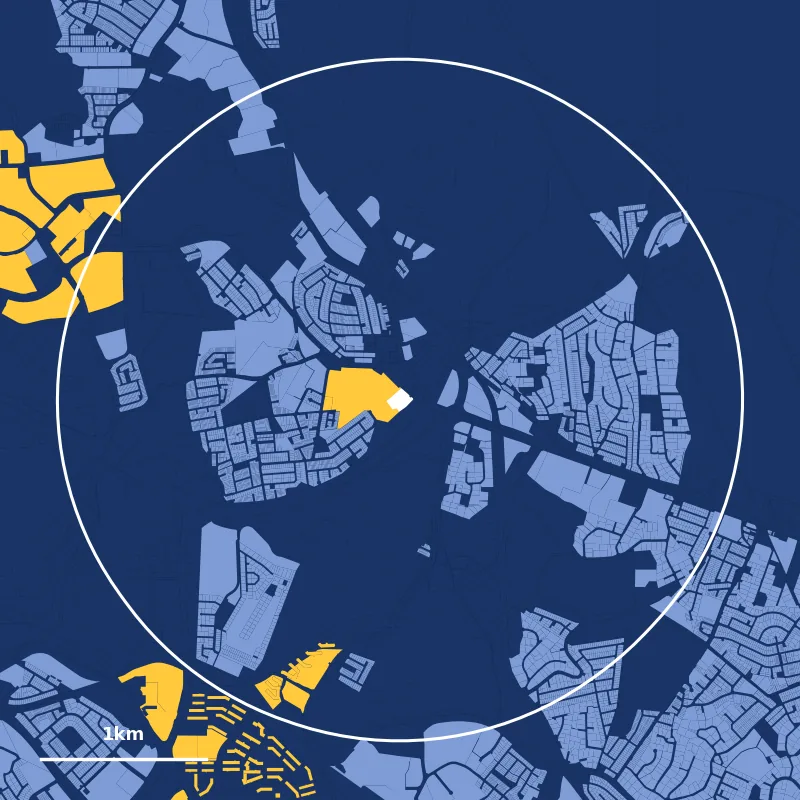
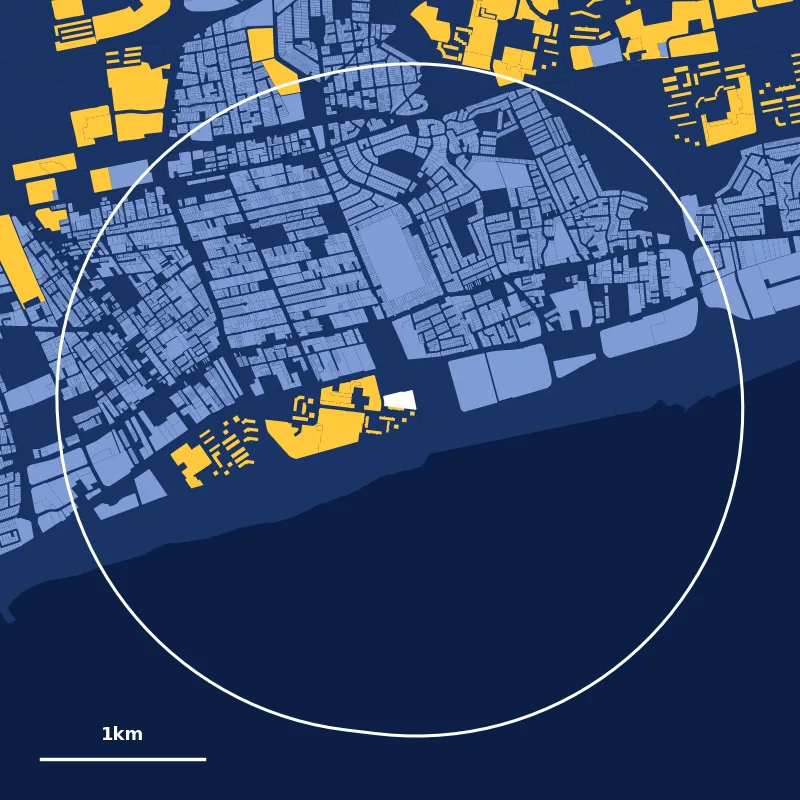
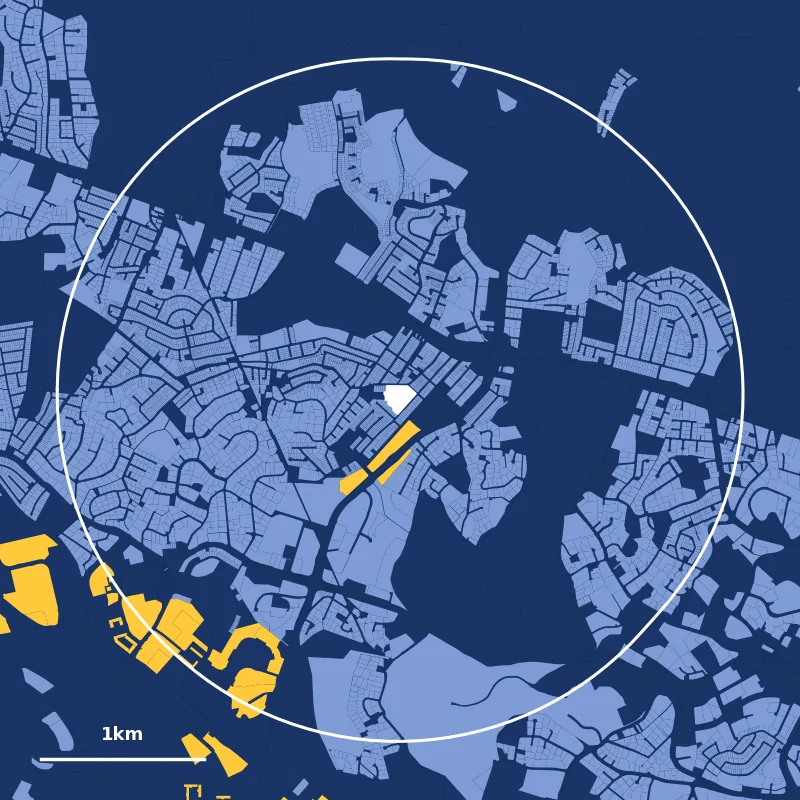
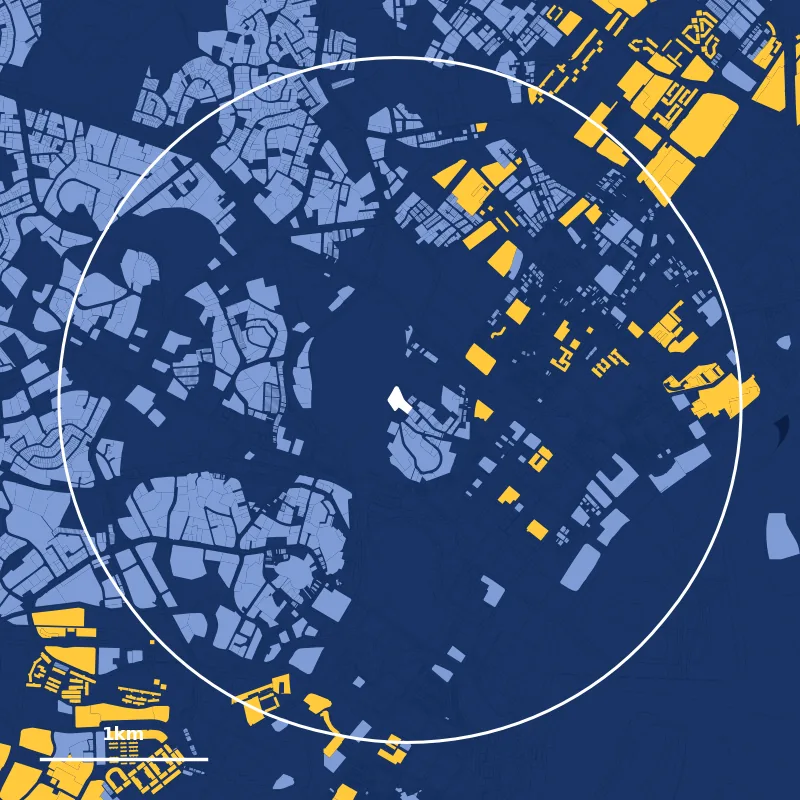
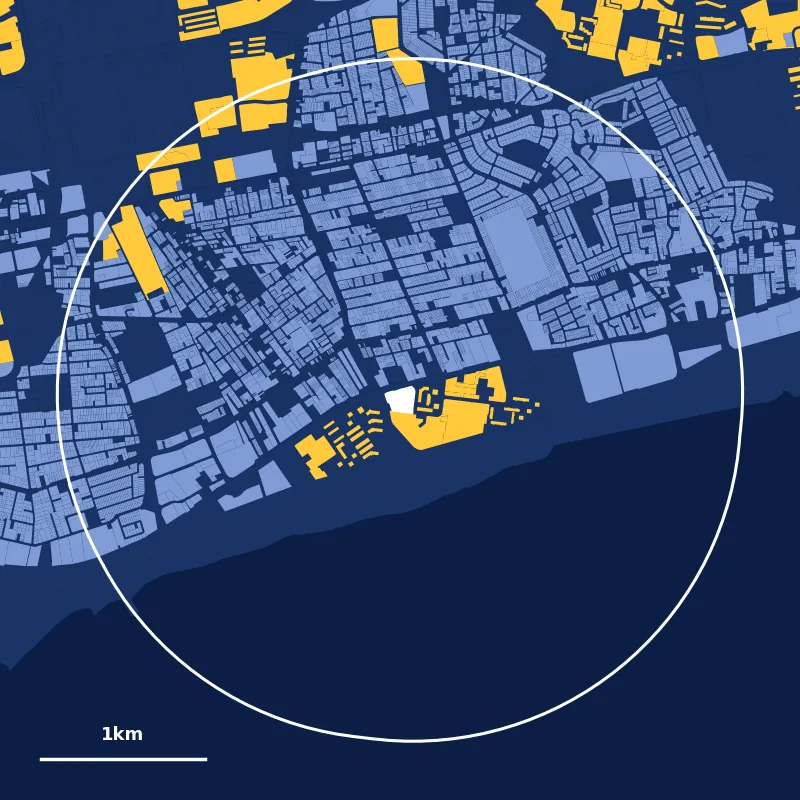
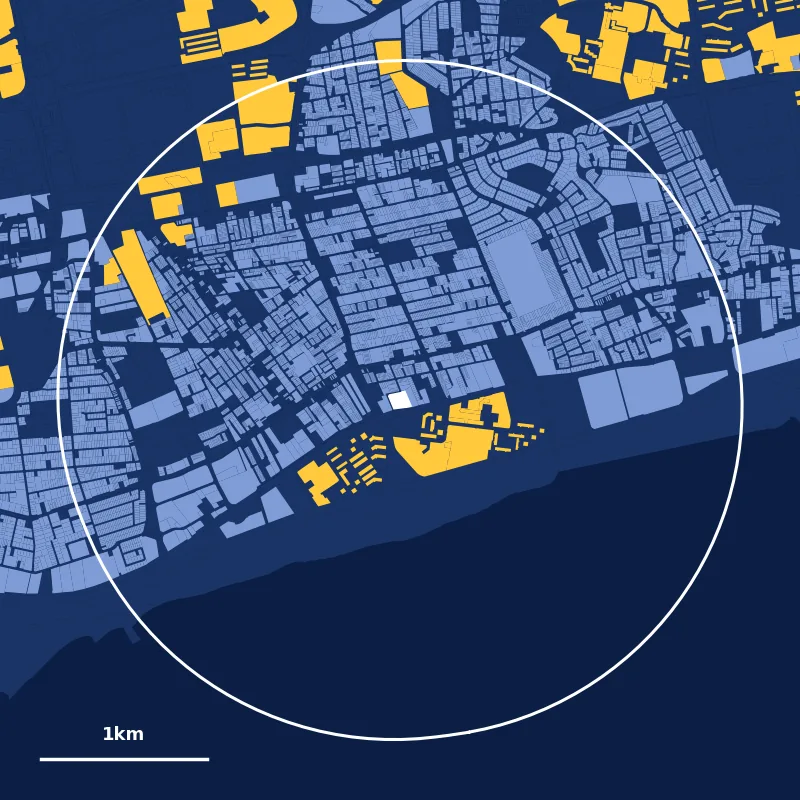
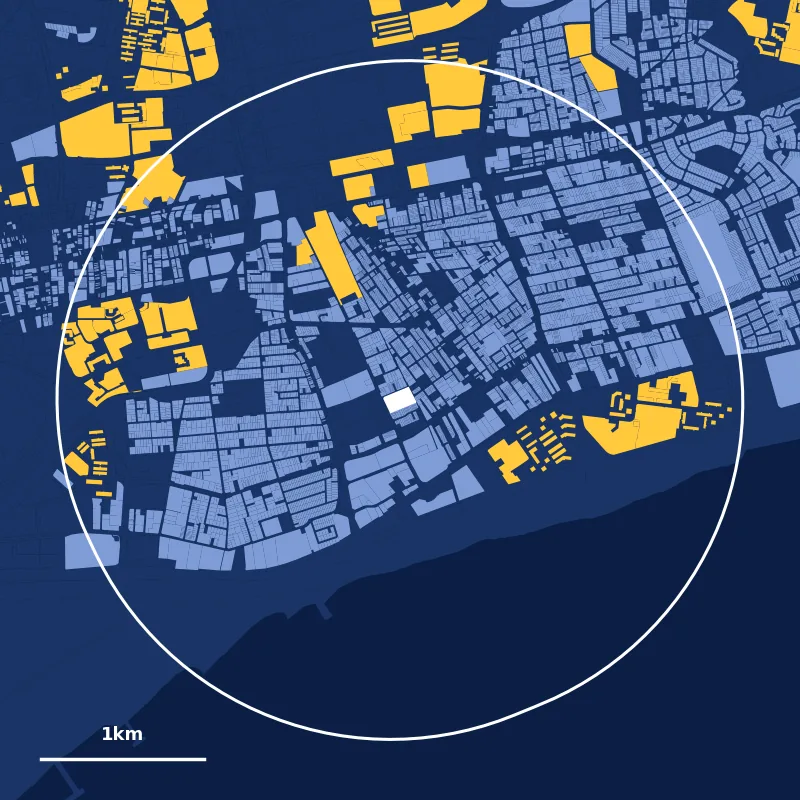
What does the area within 2km of each school look like?
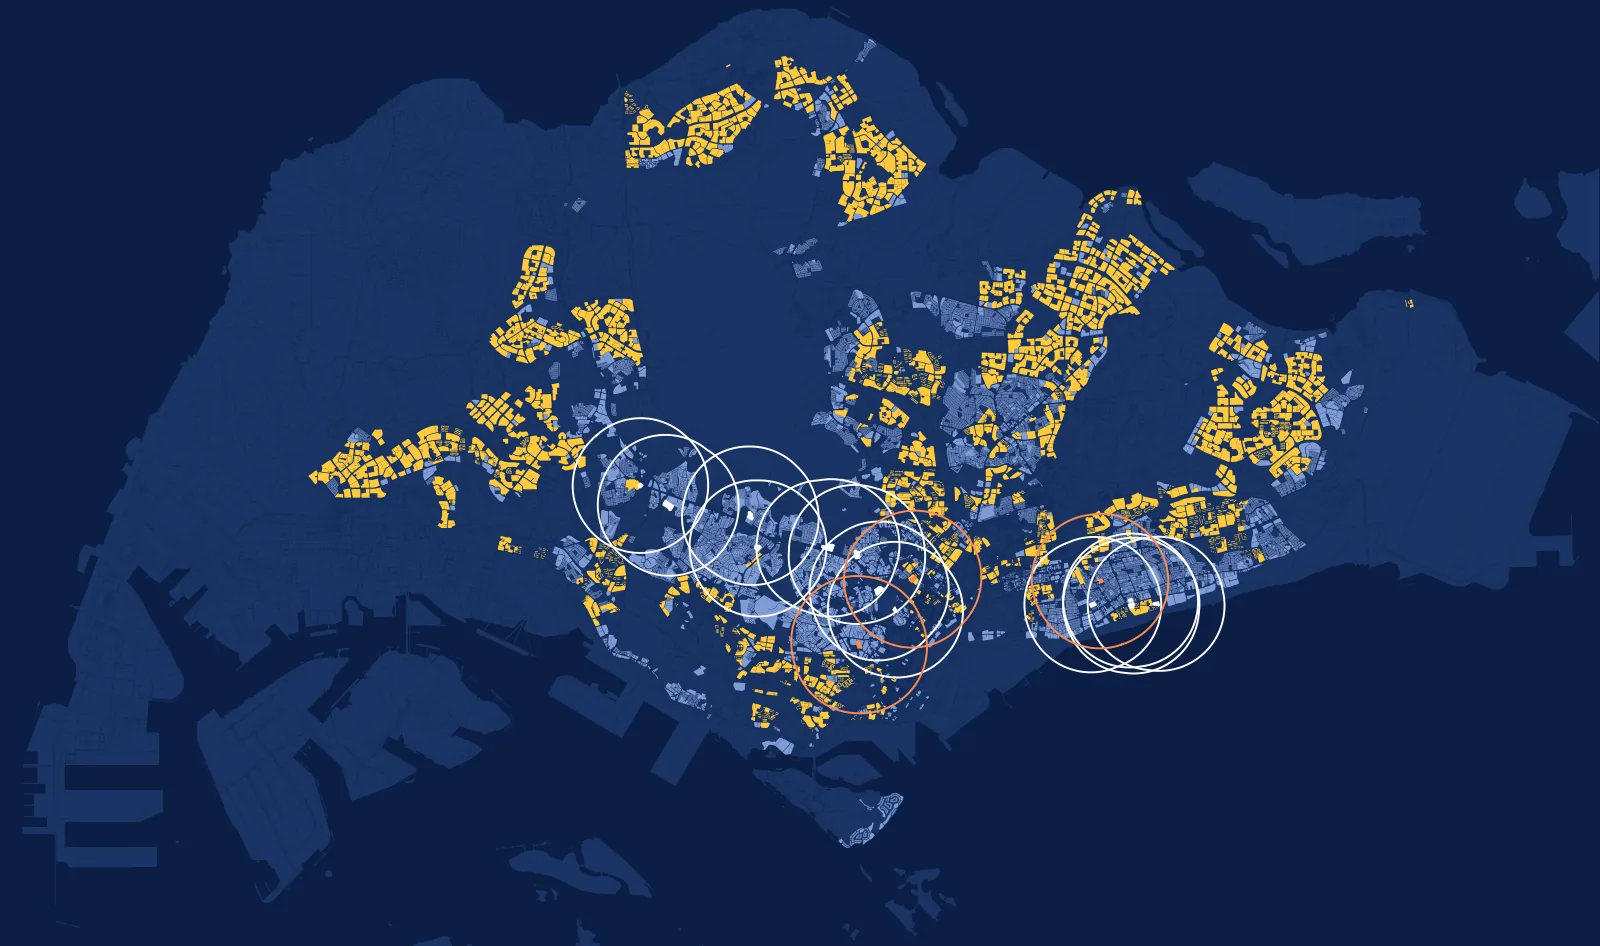
- HDB land plot
- Private homes (condos, apartments, executive condos and landed)
- 2km from a two-track school
- 2km from River Valley, Haig Girls’ or Farrer Park
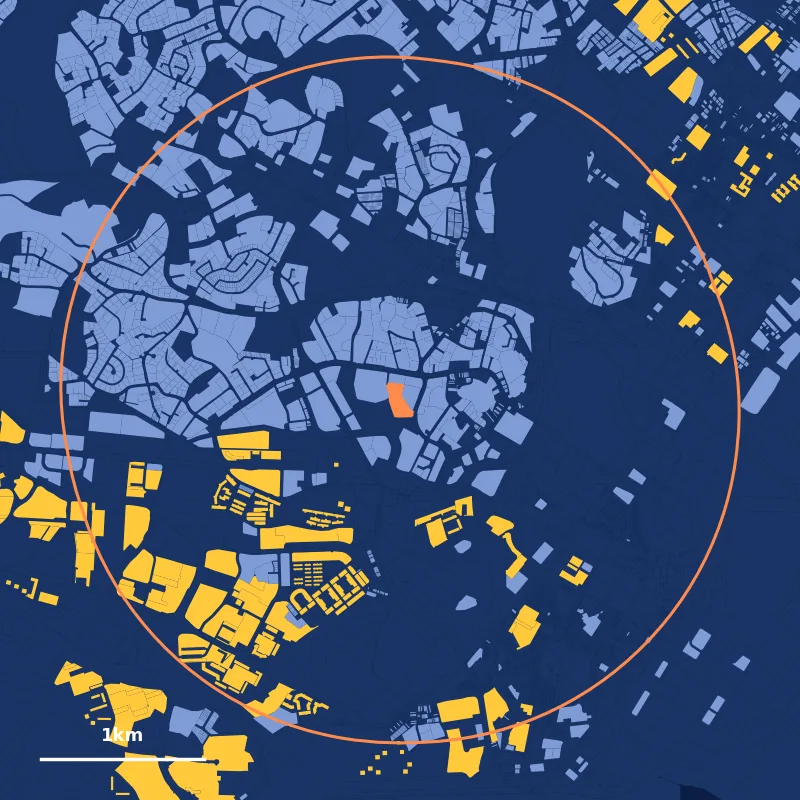
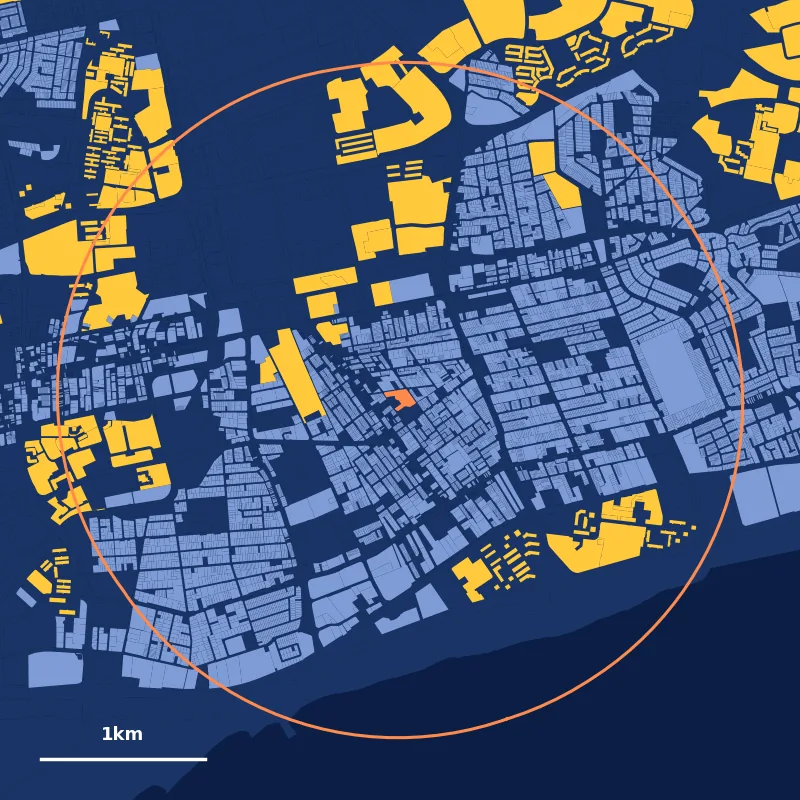
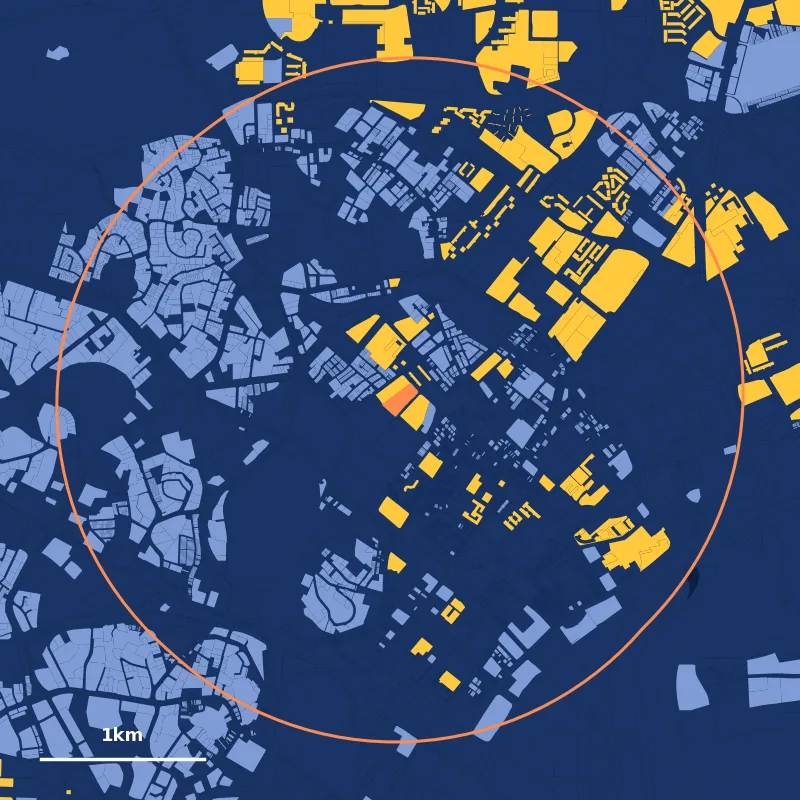
The colours show land plots, not the number of homes. One HDB plot can hold hundreds of flats, while a landed estate is many small plots with one home each, so private homes cover more ground than their number of homes would suggest. Tap a map to open it full size.

What got me thinking about this
In September 2026, The Straits Times published how much public housing surrounds each of the 12 two-track schools. I wanted to know two things. Could I get the same numbers from the same public data? And how does every other school compare? MOE says it will review the list from time to time, so the next question was which schools come closest to 40%. Then somehow it’s 2am.

Do these numbers match the published figures for the 12 schools?
The Straits Times published its own figures for the 12 schools, using HDB’s and URA’s data. I followed the method it published: homes counted building by building, and distance measured from the edge of each school’s land plot. For 11 of the 12 schools, this page’s figures are the same as The Straits Times’ or almost the same. For example, Singapore Chinese Girls’ Primary is 6% on this page and 7% in The Straits Times. The biggest difference is at Methodist Girls’ (Primary): 10% on this page, 13% in The Straits Times.
| School | The Straits Times | This page |
|---|---|---|
| Raffles Girls’ Primary School | 5% | 5% |
| Singapore Chinese Girls’ Primary School | 7% | 6% |
| Methodist Girls’ School (Primary) | 13% | 10% |
| Anglo-Chinese School (Junior) | 15% | 16% |
| Anglo-Chinese School (Primary) | 18% | 19% |
| Pei Hwa Presbyterian Primary School | 20% | 19% |
| Ngee Ann Primary School | 23% | 22% |
| Nanyang Primary School | 23% | 24% |
| St Margaret’s School (Primary) | 25% | 26% |
| Tao Nan School | 28% | 28% |
| CHIJ (Katong) Primary | 30% | 30% |
| Tanjong Katong Primary School | 37% | 38% |
| All other primary schools | 79% | 79% |
The Straits Times’ figure for all other primary schools is 79%, the same as the average on this page.
What if the 2km boundary is drawn slightly differently?
MOE’s own count may draw the 2km boundary slightly differently, or use data from another date. To see how much that matters, I recounted with the boundary drawn 100m and 200m closer to each school, and 100m and 200m further out:
| School | 1.8km | 1.9km | 2km | 2.1km | 2.2km |
|---|---|---|---|---|---|
| River Valley Primary School | 38% | 41% | 41% | 42% | 42% |
| Haig Girls’ School | 39% | 41% | 42% | 44% | 46% |
| Farrer Park Primary School | 47% | 47% | 46% | 47% | 47% |
| Tanjong Katong Primary School | 34% | 36% | 38% | 37% | 37% |
Haig Girls’ goes from about 41% to about 44% as the boundary moves from 1.9km to 2.1km, because HDB estates sit right on its 2km boundary. You can see the ring cut through them on its map above. River Valley drops to about 38% if the boundary is drawn 200m closer. Farrer Park stays at 46% to 47% at every distance, so it’s above 40% whichever way the boundary is drawn.
What happened in Phase 2C at River Valley, Haig Girls’, Farrer Park and Tanjong Katong?
Here are the 2022 to 2026 Phase 2C results for citizen families at River Valley, Haig Girls’ and Farrer Park, the three schools just above 40% public housing within 2km, and at Tanjong Katong Primary, the two-track school just below it. These are the results under the old rules, where families within 1km went first, then 1 to 2km, then more than 2km.
| School | 2022 | 2023 | 2024 | 2025 | 2026 |
|---|---|---|---|---|---|
| River Valley Primary School41% public housing within 2km | Ballot: citizens within 1km | Ballot: citizens 1 to 2km away | Ballot: citizens 1 to 2km away | Every family who applied got a place | Every citizen got a place |
| Haig Girls’ School42% public housing within 2km | Every family who applied got a place | Every citizen got a place | Every family who applied got a place | Every family who applied got a place | Every family who applied got a place |
| Farrer Park Primary School46% public housing within 2km | Every family who applied got a place | Every family who applied got a place | Every family who applied got a place | Every family who applied got a place | Every family who applied got a place |
| Tanjong Katong Primary School38% public housing within 2km | Ballot: citizens more than 2km away | Ballot: citizens 1 to 2km away | Ballot: citizens 1 to 2km away | Ballot: citizens 1 to 2km away | Ballot: citizens within 1km |
At Haig Girls’ and Farrer Park, every citizen family who applied in Phase 2C got a place, every year from 2022 to 2026. At Farrer Park, fewer families applied than there were places every year. In those years, splitting the places into a within-2km group and a more-than-2km group wouldn’t have changed who got in, because MOE moves unfilled places in one group to citizens in the other.
River Valley had a ballot among citizens in 2022, 2023 and 2024, and every citizen got a place in 2025 and 2026. Tanjong Katong Primary had a ballot among citizens every year. These are past results, and they don’t guarantee anything in 2027.
What would raise or lower the public housing percentage near a school?
A change in the homes within 2km, or a change in where the school is. A new condo or landed home nearby lowers public housing as a percentage of homes within 2km. A new HDB block raises it. To be below 40%, a school needs more than 3 private homes for every 2 HDB flats within 2km.
A school moving to a new site also changes which homes are within 2km of it. Anglo-Chinese School (Primary) leaves the two-track scheme when it moves to Tengah in 2030. As of October 2026, I couldn’t find any announced move for River Valley, Haig Girls’, Farrer Park or Tanjong Katong Primary. Homes count once they’re built, so a condo still under construction isn’t in these figures.
All 182 primary schools: public housing within 1km to 5km
Every primary school in the data, ranked by public housing as a percentage of homes within 2km. MOE chose the 12 as schools where public housing is less than 40% of the homes within 2km. The 1km, 3km, 4km and 5km figures show how the public housing percentage changes closer to and further from each school.
Show all 182 schools
| # | School | Town | 1km | 2km | 3km | 4km | 5km | Homes within 2km |
|---|---|---|---|---|---|---|---|---|
| 1 | Raffles Girls’ Primary SchoolTwo-track | Bukit Timah | 0% | 5% | 30% | 38% | 46% | 17,075 |
| 2 | Singapore Chinese Girls’ Primary SchoolTwo-track | Novena | 0% | 6% | 28% | 51% | 57% | 34,368 |
| 3 | Methodist Girls’ School (Primary)Two-track | Bukit Timah | 4% | 10% | 48% | 50% | 59% | 26,807 |
| 4 | Anglo-Chinese School (Junior)Two-track | Central | 7% | 16% | 44% | 55% | 57% | 70,038 |
| 5 | Anglo-Chinese School (Primary)Two-track | Novena | 0% | 19% | 44% | 52% | 56% | 47,483 |
| 6 | Pei Hwa Presbyterian Primary SchoolTwo-track | Bukit Timah | 16% | 19% | 43% | 59% | 65% | 22,726 |
| 7 | Ngee Ann Primary SchoolTwo-track | Marine Parade | 47% | 22% | 49% | 59% | 60% | 36,474 |
| 8 | Nanyang Primary SchoolTwo-track | Bukit Timah | 9% | 24% | 43% | 38% | 49% | 26,221 |
| 9 | St Margaret’s School (Primary)Two-track | Central | 22% | 26% | 40% | 54% | 57% | 67,117 |
| 10 | Tao Nan SchoolTwo-track | Marine Parade | 44% | 28% | 44% | 60% | 60% | 47,031 |
| 11 | CHIJ (Katong) PrimaryTwo-track | Bedok | 43% | 30% | 47% | 60% | 60% | 49,326 |
| 12 | Tanjong Katong Primary SchoolTwo-track | Marine Parade | 17% | 38% | 47% | 57% | 61% | 60,661 |
| MOE’s stated criterion for the 12: public housing is less than 40% of homes within 2km | ||||||||
| 13 | River Valley Primary School | Central | 27% | 41% | 45% | 49% | 56% | 81,068 |
| 14 | Haig Girls’ School | Geylang | 23% | 42% | 53% | 59% | 62% | 69,115 |
| 15 | Farrer Park Primary School | Kallang | 45% | 46% | 51% | 53% | 56% | 76,796 |
| 16 | St Joseph’s Institution Junior | Novena | 20% | 50% | 52% | 52% | 56% | 79,061 |
| 17 | Kong Hwa School | Geylang | 44% | 51% | 54% | 59% | 60% | 67,939 |
| 18 | Bukit Timah Primary School | Bukit Timah | 20% | 53% | 57% | 65% | 69% | 38,651 |
| 19 | Alexandra Primary School | Bukit Merah | 59% | 56% | 53% | 48% | 49% | 91,219 |
| 20 | Temasek Primary School | Bedok | 48% | 58% | 62% | 67% | 69% | 44,666 |
| 21 | Yangzheng Primary School | Serangoon | 61% | 60% | 74% | 75% | 72% | 84,307 |
| 22 | Paya Lebar Methodist Girls’ School (Primary) | Hougang | 54% | 61% | 68% | 73% | 73% | 63,788 |
| 23 | CHIJ Our Lady Queen of Peace | Bukit Panjang | 22% | 61% | 73% | 77% | 77% | 50,272 |
| 24 | Henry Park Primary School | Bukit Timah | 55% | 61% | 57% | 50% | 53% | 45,493 |
| 25 | Maris Stella High School | Toa Payoh | 58% | 62% | 70% | 72% | 68% | 68,416 |
| 26 | Cantonment Primary School | Bukit Merah | 55% | 63% | 51% | 52% | 48% | 56,135 |
| 27 | Clementi Primary School | Clementi | 73% | 63% | 61% | 64% | 63% | 48,016 |
| 28 | Zhangde Primary School | Bukit Merah | 81% | 63% | 54% | 49% | 47% | 89,454 |
| 29 | St Stephen’s School | Bedok | 31% | 64% | 61% | 61% | 63% | 83,446 |
| 30 | Pei Tong Primary School | Clementi | 77% | 64% | 54% | 61% | 59% | 50,254 |
| 31 | Zhonghua Primary School | Serangoon | 55% | 64% | 75% | 76% | 74% | 81,567 |
| 32 | Geylang Methodist School (Primary) | Geylang | 61% | 64% | 59% | 61% | 61% | 67,620 |
| 33 | Xinghua Primary School | Hougang | 71% | 64% | 68% | 74% | 76% | 66,556 |
| 34 | Opera Estate Primary School | Bedok | 63% | 65% | 64% | 61% | 65% | 84,688 |
| 35 | Nan Hua Primary School | Clementi | 63% | 65% | 62% | 63% | 65% | 46,258 |
| 36 | Queenstown Primary School | Queenstown | 75% | 66% | 62% | 50% | 48% | 58,095 |
| 37 | Fairfield Methodist School (Primary) | Queenstown | 73% | 66% | 64% | 57% | 55% | 44,516 |
| 38 | Canossa Catholic Primary School | Geylang | 80% | 66% | 67% | 62% | 62% | 77,304 |
| 39 | Maha Bodhi School | Geylang | 85% | 67% | 61% | 61% | 65% | 57,042 |
| 40 | New Town Primary School | Queenstown | 79% | 67% | 58% | 55% | 51% | 59,731 |
| 41 | Cedar Primary School | Toa Payoh | 57% | 68% | 70% | 68% | 65% | 81,080 |
| 42 | Bedok Green Primary School | Bedok | 77% | 68% | 67% | 69% | 68% | 79,304 |
| 43 | Hong Wen School | Kallang | 68% | 68% | 61% | 55% | 56% | 108,674 |
| 44 | CHIJ Primary (Toa Payoh) | Toa Payoh | 74% | 69% | 59% | 61% | 57% | 75,571 |
| 45 | Keming Primary School | Bukit Batok | 83% | 70% | 71% | 73% | 75% | 67,074 |
| 46 | Pasir Ris Primary School | Pasir Ris | 76% | 70% | 75% | 77% | 75% | 51,114 |
| 47 | Qifa Primary School | Clementi | 48% | 70% | 64% | 66% | 65% | 44,826 |
| 48 | Rosyth School | Serangoon | 78% | 71% | 74% | 76% | 76% | 81,707 |
| 49 | Bendemeer Primary School | Kallang | 82% | 71% | 66% | 60% | 54% | 91,381 |
| 50 | Holy Innocents’ Primary School | Hougang | 74% | 71% | 75% | 75% | 78% | 81,290 |
| 51 | First Toa Payoh Primary School | Toa Payoh | 93% | 72% | 70% | 69% | 65% | 97,408 |
| 52 | Ai Tong School | Bishan | 53% | 72% | 79% | 74% | 66% | 49,434 |
| 53 | Pei Chun Public School | Toa Payoh | 94% | 72% | 68% | 67% | 63% | 98,767 |
| 54 | CHIJ Our Lady of Good Counsel | Serangoon | 58% | 73% | 74% | 74% | 73% | 79,009 |
| 55 | Casuarina Primary School | Pasir Ris | 81% | 73% | 78% | 77% | 75% | 65,943 |
| 56 | Bukit Panjang Primary School | Bukit Panjang | 69% | 73% | 73% | 77% | 78% | 60,613 |
| 57 | Gan Eng Seng Primary School | Bukit Merah | 81% | 73% | 60% | 51% | 48% | 87,462 |
| 58 | Telok Kurau Primary School | Bedok | 76% | 73% | 67% | 64% | 64% | 59,351 |
| 59 | White Sands Primary School | Pasir Ris | 82% | 73% | 76% | 77% | 74% | 72,699 |
| 60 | CHIJ St Nicholas Girls’ School | Ang Mo Kio | 71% | 74% | 74% | 70% | 74% | 55,284 |
| 61 | Anderson Primary School | Ang Mo Kio | 66% | 74% | 76% | 72% | 76% | 43,940 |
| 62 | Xinmin Primary School | Hougang | 82% | 74% | 74% | 76% | 78% | 103,222 |
| 63 | Kheng Cheng School | Toa Payoh | 89% | 74% | 66% | 65% | 61% | 77,842 |
| 64 | Fengshan Primary School | Bedok | 91% | 75% | 67% | 71% | 68% | 86,935 |
| 65 | Changkat Primary School | Tampines | 62% | 75% | 77% | 75% | 72% | 78,140 |
| 66 | CHIJ (Kellock) | Bukit Merah | 88% | 75% | 59% | 52% | 48% | 67,122 |
| 67 | Meridian Primary School | Pasir Ris | 74% | 75% | 82% | 80% | 80% | 41,477 |
| 68 | Marymount Convent School | Toa Payoh | 82% | 75% | 66% | 65% | 59% | 63,035 |
| 69 | East Spring Primary School | Tampines | 64% | 76% | 76% | 73% | 76% | 73,412 |
| 70 | Park View Primary School | Pasir Ris | 66% | 76% | 83% | 79% | 79% | 43,130 |
| 71 | Montfort Junior School | Hougang | 86% | 76% | 77% | 76% | 77% | 114,437 |
| 72 | St Gabriel’s Primary School | Serangoon | 64% | 76% | 73% | 73% | 70% | 89,590 |
| 73 | St Andrew’s School (Junior) | Toa Payoh | 71% | 76% | 70% | 63% | 62% | 89,342 |
| 74 | Yio Chu Kang Primary School | Hougang | 89% | 76% | 76% | 76% | 78% | 126,702 |
| 75 | Bukit View Primary School | Bukit Batok | 88% | 76% | 73% | 74% | 76% | 73,003 |
| 76 | Blangah Rise Primary School | Bukit Merah | 83% | 77% | 71% | 60% | 52% | 55,029 |
| 77 | Hougang Primary School | Hougang | 91% | 78% | 75% | 76% | 78% | 114,790 |
| 78 | Radin Mas Primary School | Bukit Merah | 91% | 78% | 60% | 53% | 48% | 69,811 |
| 79 | Sengkang Green Primary School | Seng Kang | 72% | 78% | 81% | 78% | 80% | 64,447 |
| 80 | Ang Mo Kio Primary School | Ang Mo Kio | 86% | 78% | 73% | 73% | 71% | 77,216 |
| 81 | CHIJ Our Lady of the Nativity | Hougang | 68% | 78% | 79% | 77% | 78% | 86,787 |
| 82 | Lianhua Primary School | Bukit Batok | 81% | 79% | 75% | 77% | 76% | 78,244 |
| 83 | Red Swastika School | Bedok | 89% | 79% | 72% | 72% | 69% | 92,910 |
| 84 | Yu Neng Primary School | Bedok | 90% | 79% | 71% | 72% | 69% | 90,634 |
| 85 | Zhenghua Primary School | Bukit Panjang | 87% | 79% | 74% | 78% | 78% | 56,736 |
| 86 | Fern Green Primary School | Seng Kang | 81% | 79% | 82% | 80% | 80% | 72,446 |
| 87 | Wellington Primary School | Sembawang | 86% | 79% | 86% | 89% | 88% | 47,025 |
| 88 | St Anthony’s Canossian Primary School | Bedok | 75% | 79% | 75% | 71% | 70% | 97,944 |
| 89 | Damai Primary SchoolNo Primary 1 intake 2025 to 2027 | Bedok | 89% | 80% | 71% | 71% | 67% | 74,638 |
| 90 | Catholic High School | Bishan | 73% | 80% | 78% | 69% | 66% | 88,260 |
| 91 | Mayflower Primary School | Ang Mo Kio | 85% | 80% | 71% | 71% | 74% | 67,968 |
| 92 | Elias Park Primary School | Pasir Ris | 63% | 80% | 82% | 77% | 77% | 67,524 |
| 93 | Fernvale Primary School | Seng Kang | 73% | 80% | 79% | 78% | 78% | 70,997 |
| 94 | Unity Primary School | Choa Chu Kang | 86% | 80% | 87% | 86% | 84% | 23,263 |
| 95 | Kuo Chuan Presbyterian Primary School | Bishan | 76% | 81% | 72% | 69% | 69% | 96,675 |
| 96 | Punggol Primary School | Hougang | 75% | 81% | 79% | 77% | 77% | 116,242 |
| 97 | Townsville Primary SchoolNo Primary 1 intake 2025 to 2027 | Ang Mo Kio | 86% | 81% | 75% | 70% | 72% | 81,798 |
| 98 | Gongshang Primary School | Tampines | 96% | 81% | 75% | 76% | 76% | 120,545 |
| 99 | Tampines Primary School | Tampines | 93% | 82% | 77% | 76% | 72% | 111,703 |
| 100 | St Anthony’s Primary School | Bukit Batok | 92% | 82% | 83% | 80% | 79% | 91,950 |
| 101 | Poi Ching School | Tampines | 87% | 82% | 82% | 77% | 75% | 81,472 |
| 102 | North Spring Primary School | Seng Kang | 86% | 82% | 84% | 82% | 77% | 126,677 |
| 103 | West View Primary School | Bukit Panjang | 91% | 83% | 80% | 81% | 80% | 77,802 |
| 104 | Palm View Primary School | Seng Kang | 86% | 83% | 79% | 78% | 78% | 138,280 |
| 105 | Tampines North Primary School | Tampines | 94% | 83% | 76% | 75% | 77% | 119,890 |
| 106 | Chongzheng Primary School | Tampines | 88% | 83% | 75% | 76% | 74% | 105,286 |
| 107 | Yumin Primary School | Tampines | 88% | 83% | 75% | 76% | 74% | 105,286 |
| 108 | Seng Kang Primary School | Seng Kang | 88% | 83% | 83% | 81% | 78% | 135,386 |
| 109 | Teck Ghee Primary School | Ang Mo Kio | 97% | 83% | 72% | 73% | 72% | 77,853 |
| 110 | Springdale Primary School | Seng Kang | 82% | 83% | 83% | 80% | 79% | 124,780 |
| 111 | South View Primary School | Choa Chu Kang | 84% | 84% | 85% | 83% | 82% | 71,020 |
| 112 | Beacon Primary School | Bukit Panjang | 95% | 84% | 73% | 76% | 77% | 46,644 |
| 113 | Rivervale Primary School | Seng Kang | 90% | 84% | 85% | 83% | 79% | 129,039 |
| 114 | Sembawang Primary School | Sembawang | 80% | 84% | 86% | 89% | 88% | 63,205 |
| 115 | Jing Shan Primary School | Ang Mo Kio | 97% | 84% | 71% | 72% | 74% | 71,178 |
| 116 | North Vista Primary School | Seng Kang | 80% | 84% | 80% | 78% | 77% | 130,943 |
| 117 | Junyuan Primary School | Tampines | 93% | 84% | 80% | 75% | 70% | 103,736 |
| 118 | Dazhong Primary School | Bukit Batok | 94% | 84% | 79% | 79% | 79% | 90,101 |
| 119 | Greenridge Primary School | Bukit Panjang | 94% | 84% | 78% | 78% | 79% | 53,160 |
| 120 | Anchor Green Primary School | Seng Kang | 80% | 84% | 81% | 79% | 79% | 126,791 |
| 121 | Teck Whye Primary School | Choa Chu Kang | 80% | 85% | 81% | 82% | 81% | 87,735 |
| 122 | Jiemin Primary School | Yishun | 91% | 85% | 86% | 86% | 85% | 84,947 |
| 123 | Compassvale Primary School | Seng Kang | 87% | 85% | 84% | 82% | 79% | 135,497 |
| 124 | Angsana Primary School | Tampines | 82% | 85% | 79% | 77% | 78% | 96,196 |
| 125 | West Spring Primary School | Bukit Panjang | 98% | 85% | 80% | 78% | 80% | 55,367 |
| 126 | Nan Chiau Primary School | Seng Kang | 85% | 85% | 82% | 79% | 79% | 136,325 |
| 127 | Endeavour Primary School | Sembawang | 100% | 85% | 87% | 88% | 89% | 47,405 |
| 128 | Canberra Primary School | Sembawang | 93% | 85% | 87% | 88% | 89% | 55,342 |
| 129 | Northoaks Primary School | Sembawang | 100% | 85% | 86% | 88% | 90% | 42,072 |
| 130 | St Hilda’s Primary School | Tampines | 86% | 85% | 81% | 75% | 71% | 94,075 |
| 131 | Mee Toh School | Punggol | 90% | 85% | 84% | 84% | 80% | 112,027 |
| 132 | De La Salle School | Choa Chu Kang | 78% | 86% | 85% | 87% | 82% | 45,352 |
| 133 | Xishan Primary School | Yishun | 88% | 86% | 86% | 86% | 86% | 92,770 |
| 134 | Kranji Primary SchoolNo Primary 1 intake 2025 to 2027 | Choa Chu Kang | 79% | 86% | 86% | 85% | 82% | 58,321 |
| 135 | Ahmad Ibrahim Primary School | Yishun | 86% | 86% | 87% | 86% | 87% | 87,354 |
| 136 | Yishun Primary School | Yishun | 88% | 87% | 86% | 85% | 87% | 89,366 |
| 137 | Chongfu School | Yishun | 86% | 87% | 87% | 86% | 87% | 77,397 |
| 138 | Concord Primary School | Choa Chu Kang | 95% | 87% | 88% | 84% | 83% | 46,027 |
| 139 | Northshore Primary School | Punggol | 97% | 87% | 87% | 88% | 84% | 42,171 |
| 140 | Lakeside Primary School | Jurong West | 77% | 87% | 90% | 91% | 88% | 68,933 |
| 141 | Valour Primary School | Punggol | 83% | 87% | 85% | 84% | 82% | 94,767 |
| 142 | Greendale Primary School | Punggol | 91% | 88% | 84% | 85% | 81% | 88,490 |
| 143 | Chua Chu Kang Primary School | Choa Chu Kang | 84% | 88% | 86% | 83% | 81% | 62,687 |
| 144 | Punggol View Primary School | Punggol | 85% | 88% | 86% | 84% | 83% | 103,924 |
| 145 | Rulang Primary School | Jurong West | 83% | 88% | 90% | 91% | 88% | 71,174 |
| 146 | Edgefield Primary School | Punggol | 88% | 88% | 84% | 85% | 82% | 111,453 |
| 147 | Yew Tee Primary School | Choa Chu Kang | 85% | 88% | 86% | 84% | 82% | 50,110 |
| 148 | Shuqun Primary School | Jurong West | 83% | 88% | 90% | 91% | 84% | 77,754 |
| 149 | Punggol Green Primary School | Punggol | 82% | 88% | 85% | 84% | 80% | 119,025 |
| 150 | Peiying Primary School | Yishun | 91% | 88% | 83% | 81% | 83% | 65,941 |
| 151 | Punggol Cove Primary School | Punggol | 83% | 88% | 88% | 85% | 83% | 69,692 |
| 152 | Fuhua Primary School | Jurong East | 80% | 89% | 86% | 80% | 79% | 61,827 |
| 153 | Corporation Primary School | Jurong West | 98% | 89% | 89% | 91% | 92% | 67,091 |
| 154 | Horizon Primary School | Punggol | 89% | 89% | 86% | 84% | 82% | 88,219 |
| 155 | Jurong Primary School | Jurong East | 90% | 89% | 89% | 84% | 79% | 92,045 |
| 156 | Boon Lay Garden Primary School | Jurong West | 86% | 89% | 89% | 91% | 91% | 75,305 |
| 157 | Yuhua Primary School | Jurong East | 89% | 89% | 84% | 77% | 77% | 76,956 |
| 158 | Huamin Primary School | Yishun | 90% | 90% | 85% | 85% | 81% | 80,454 |
| 159 | Oasis Primary School | Punggol | 86% | 90% | 88% | 84% | 83% | 95,078 |
| 160 | Princess Elizabeth Primary School | Bukit Batok | 94% | 90% | 84% | 77% | 79% | 94,369 |
| 161 | Waterway Primary School | Punggol | 88% | 90% | 86% | 83% | 82% | 62,261 |
| 162 | Woodlands Ring Primary School | Woodlands | 94% | 90% | 91% | 88% | 89% | 63,209 |
| 163 | Northland Primary School | Yishun | 89% | 91% | 86% | 81% | 80% | 78,504 |
| 164 | Naval Base Primary School | Yishun | 88% | 91% | 84% | 79% | 80% | 67,082 |
| 165 | Evergreen Primary School | Woodlands | 100% | 91% | 92% | 88% | 89% | 67,367 |
| 166 | Westwood Primary School | Jurong West | 93% | 91% | 90% | 89% | 91% | 60,259 |
| 167 | Pioneer Primary School | Tengah | 95% | 91% | 89% | 84% | 80% | 85,575 |
| 168 | Woodlands Primary School | Woodlands | 93% | 92% | 92% | 89% | 88% | 76,935 |
| 169 | North View Primary School | Yishun | 91% | 92% | 87% | 84% | 81% | 67,588 |
| 170 | Riverside Primary School | Woodlands | 93% | 92% | 88% | 89% | 89% | 65,484 |
| 171 | Qihua Primary School | Woodlands | 99% | 92% | 92% | 92% | 88% | 78,608 |
| 172 | Greenwood Primary School | Woodlands | 90% | 93% | 86% | 89% | 89% | 70,239 |
| 173 | Frontier Primary School | Jurong West | 97% | 93% | 89% | 89% | 90% | 53,836 |
| 174 | Woodgrove Primary School | Woodlands | 89% | 93% | 92% | 90% | 88% | 73,541 |
| 175 | Jurong West Primary School | Jurong West | 97% | 93% | 89% | 89% | 90% | 54,089 |
| 176 | Marsiling Primary School | Woodlands | 98% | 93% | 92% | 92% | 91% | 38,259 |
| 177 | Si Ling Primary School | Woodlands | 91% | 93% | 92% | 92% | 88% | 67,610 |
| 178 | Innova Primary School | Woodlands | 84% | 93% | 92% | 90% | 87% | 67,697 |
| 179 | West Grove Primary School | Jurong West | 93% | 93% | 90% | 89% | 90% | 56,962 |
| 180 | Admiralty Primary School | Woodlands | 96% | 93% | 89% | 89% | 88% | 66,180 |
| 181 | Xingnan Primary School | Jurong West | 98% | 93% | 94% | 90% | 90% | 39,011 |
| 182 | Fuchun Primary School | Woodlands | 88% | 94% | 93% | 92% | 91% | 48,286 |
No school matches that name. Try part of the name, such as “Tao Nan”.
The 1km figures are the least precise: fewer homes sit within 1km, so one block moves the percentage a lot. At 1km, the figures differ more. The biggest difference is at Methodist Girls’ (Primary): 4% on this page, 8% in The Straits Times. Damai, Kranji and Townsville Primary have no Primary 1 intake from 2025 to 2027 while they relocate.
Questions people ask about this

How did MOE choose the 12 two-track schools?
MOE picked schools where public housing makes up less than 40% of the homes within 2km. Following The Straits Times’ published method, this page’s figures put the 12 between 5% (Raffles Girls’ Primary) and 38% (Tanjong Katong Primary). The other 170 primary schools are all above 40% on this page’s count, and average 79%.
Will more schools be added to the two-track list?
MOE says it will review the list from time to time, taking into account changes in the housing around each school and its experience running the scheme, but doesn’t expect frequent changes. It has named one change already: Anglo-Chinese School (Primary) leaves the scheme after it moves to Tengah in 2030. This page doesn’t predict which schools MOE will add. It shows how far each school is from 40% today.
Does “more than 2km away” mean living 3 to 5km from the school?
No. At the 12 two-track schools, the places for families more than 2km away are open to every family in Singapore living more than 2km from the school, whether that’s 3km or 25km. The 3km to 5km figures in the full table describe the neighbourhoods around each school, not who applies for those places.
Why does the map look mostly private when 41% of the homes near River Valley are HDB flats?
The map colours land plots, not homes. One HDB plot can hold several blocks and hundreds of flats, while a landed estate is many small plots with one home each. So private housing covers more ground than its number of homes would suggest. The percentages on this page count homes, not land.
Do executive condos count as public housing on this page?
No. Following The Straits Times’ method, a home counts as public housing if it’s in HDB’s data, and as private if it’s in URA’s data on private homes. Executive condos are in URA’s data, so they count as private. HDB rental flats are in HDB’s data, so they count as public housing.
Is this MOE’s own count?
No. This page follows the method The Straits Times used in its September 2026 analysis, using HDB’s and URA’s data. For the 12 schools, this page’s figures are the same as The Straits Times’ or almost the same. The biggest difference is 10% on this page against 13% in The Straits Times. MOE may draw the 2km boundary differently or use data from another date, so a school just above 40% on this page could be on either side of 40% on MOE’s count.
Are upcoming condos counted?
No. This page counts homes that are already built, using URA’s data on existing private homes. A condo still under construction isn’t included until it’s completed. At a typical school, a 1,000-home condo within 2km would take the share of public housing from about 80% to 79%. Near 137 of the 182 schools, HDB flats make up 70% or more of the homes within 2km.
If a school’s figure looks wrong, or you know of a move or a new estate near one of these schools, tell me and I’ll check it and update the page.
Message me on WhatsApp
How the numbers were worked out
- Public housing. HDB’s Property Information data: 10,796 residential blocks with 1,175,956 homes, including rental flats. Each block is placed at the centre of its footprint in HDB’s Existing Building map (November 2025). 26 blocks completed after that map are placed at the nearest block on the same street. 5 blocks with 594 homes couldn’t be placed and aren’t counted: four new blocks on Tampines Road, and one block of 8 homes on Thomson Road.
- Private homes. URA’s No of Dwelling Units data: 458,975 homes in 83,541 records, counting occupied and vacant homes. That’s 346,010 condo and apartment homes, 73,535 landed homes and 39,430 executive condo homes. URA gives each record one point on the map.
- Public or private. As in The Straits Times’ method: a home is public housing if it’s in HDB’s data and private if it’s in URA’s. So executive condos count as private and HDB rental flats as public housing.
- Distance. A straight line from the edge of the school’s land plot (SLA’s cadastral map) to each building’s point. The school’s plot is the one its address point sits in. For 8 schools that plot looked wrong, smaller than 0.6 hectares or larger than 6 hectares, so I measured from a circle the size of a typical school plot (1.8 hectares) around the address point instead: Beacon, Cedar, Kheng Cheng, Northoaks, St Andrew’s (Junior), Teck Whye, Yew Tee and Zhangde. All 8 have more than 60% public housing within 2km.
- Rounding. Percentages are rounded to whole numbers, as The Straits Times does.
- Phase 2C results. The same 2022 to 2026 results as the P1 Phase 2C checker, for Singapore citizen families.
- What this count can’t see. Homes still under construction, and the families living in each home. It counts homes, not households or children.
Update log
- 1 October 2026 — Soft launch: the page is now open to everyone. On phones, the WhatsApp button hides while you type in the school search, so it doesn’t cover the box.
- 1 October 2026 — New heading and title, which ask which schools have the least public housing within 2km rather than which could join the list. A note under the answer says the page measures and doesn’t predict. Removed “the line” throughout, and matched MOE’s wording on how the 12 were chosen and how the list is reviewed.
- 1 October 2026 — Reworded to introduce The Straits Times’ analysis before comparing with it, and to show percentages instead of percentage points. Farrer Park Primary corrected to 46% (it had been rounded to 47%). Added a search box to the table of all 182 schools and a question on upcoming condos.
- 1 October 2026 — First draft.
Where the numbers come from
- HDB blocks and homes: HDB’s HDB Property Information and HDB Existing Building on data.gov.sg.
- Private homes: URA’s No of Dwelling Units on data.gov.sg.
- School land plots: SLA’s Cadastral Land Parcel map on data.gov.sg.
- School addresses: MOE’s General Information of Schools (data.gov.sg), located with OneMap (Singapore Land Authority).
- Phase 2C results, 2022 to 2026: MOE’s past vacancies and balloting data, as used in the P1 Phase 2C checker.
- The two-track scheme and the 40% rule: MOE’s press release of 10 September 2026; the list of 12 schools is in Annex A of the release. How unfilled places move between the two groups, as reported by AsiaOne.
- The method and the comparison figures: The Straits Times’ analysis “Singapore’s new Primary 1 rules: Who lives around the 12 schools getting a wider catchment?” (September 2026).
More from Geek Out: Primary schools near my home: what’s their Phase 2C ballot history, and what changes in 2027?
Before you act on any of this. Everything on this page is worked out from public data (HDB, URA, SLA and MOE) and is for reference only. It isn’t MOE’s count, and it isn’t a claim about which schools MOE will add to the two-track list or a reason to buy or move. Distances are straight lines from map data, and MOE measures on its own basis, so check your address on MOE’s SchoolFinder or OneMap’s School Query. Living within a distance group earns a place in that group’s ballot, not a place at the school.
Your turn
Got a burning question you're dying to get an answer to?
Send it over. There's no such thing as a silly question — only the ones that keep you up at night.
Ask the Property GeekStay curious. See you down the next rabbit hole.The Property Geek & the corgi